Home >Backend Development >PHP Tutorial >Phpstorm+Xdebug breakpoint debugging PHP method php example
Phpstorm+Xdebug breakpoint debugging PHP method php example
- jackloveOriginal
- 2018-06-23 16:44:171882browse
This article mainly introduces the method of Phpstorm Xdebug breakpoint debugging PHP. This tutorial will configure the Xdebug extension for breakpoint debugging. The purpose is to improve everyone's development efficiency. Interested friends can refer to it
Why use breakpoint debugging
You may think that you can use var_dump and echo to debug. Why do you need to install Xdebug breakpoint debugging?
Indeed it is. However, the code written by var_dump and echo needs to be deleted later, and it is clear where to type it. If it is found that it does not run to the place where it was written, the code must be modified and run again. With breakpoint debugging, you can dynamically break points during the debugging process, view the current values of each variable line by line, and even temporarily modify the values of variables, which is more convenient. It is recommended that you use Xdebug breakpoint debugging.
Install Xdebug
pecl install xdebug
If it is a version below php7, you need to add the version number :
pecl install xdebug-2.5.5
pecl If the prompt cannot find the extension, use the source code to compile. For example:
wget http://pecl.php.net/get/xdebug-2.5.5.tgz \
  && tar xzf xdebug-2.5.5.tgz && cd xdebug-2.5.5/ \
  && phpize \
  && ./configure \
  && make && make install
Note: php5.6 can only use xdebug version 2.5 and below.
After installation, you need to configure it in php.ini:
[xdebug]
zend_extension=xdebug.so
xdebug.enable=1
xdebug.remote_enable=1
;如果开启此,将忽略下面的 xdebug.remote_host 的参数
;xdebug.remote_connect_back=1
;自动启动,无需XDEBUG_SESSION_START=1
xdebug.remote_autostart=1
;宿主机IP
xdebug.remote_host=192.168.36.101
xdebug.remote_port=19001
xdebug.remote_handler=dbgp
It should be noted that:
1. It is zend_extension, not extension;
2. After xdebug.remote_autostart is turned on, there is no need to manually add XDEBUG_SESSION_START=1 to the request URL. As long as Phpstorm turns on breakpoint debugging, it will be ok. Very convenient;
3, remote_host is configured on a machine with Phpstorm installed, this needs to be noted. If the machine where php is installed and the machine where Phpstorm is installed are the same machine, then write 127.0.0.1 as the address.
If you are using a docker environment, remote_hostWrite the IP of the host machine.
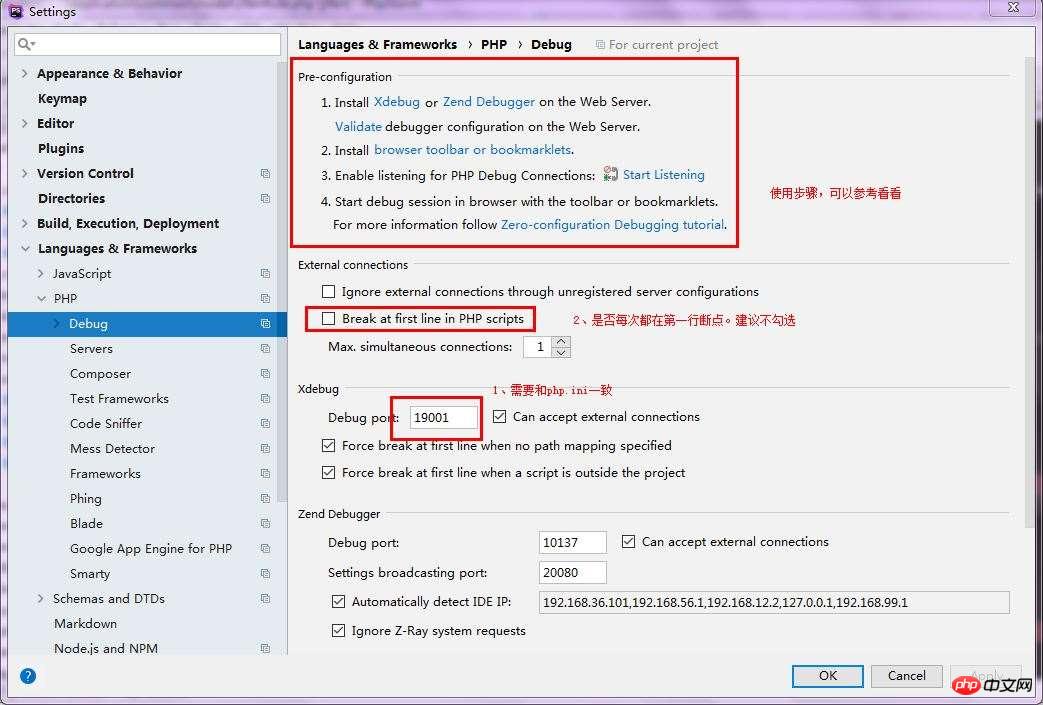
4. The xdebug.remote_port port I wrote is 19001, so Phpstorm also needs to be modified.
After the configuration is completed, php-fpm needs to be restarted.
Configuring Phpstorm
The configuration is also very simple, just configure the port:

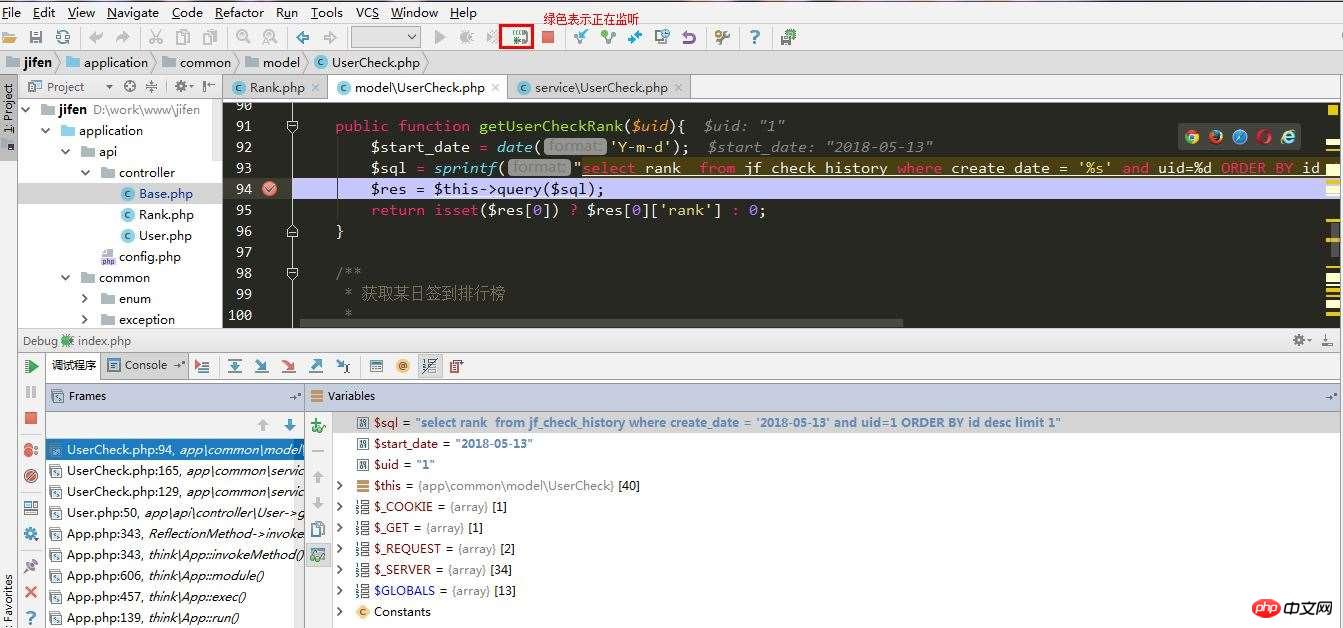
Next you can debug with breakpoints. Turn on monitoring:

#The request will be automatically captured when the url is requested.
Note:
1. Do not enable monitoring of multiple projects at the same time;
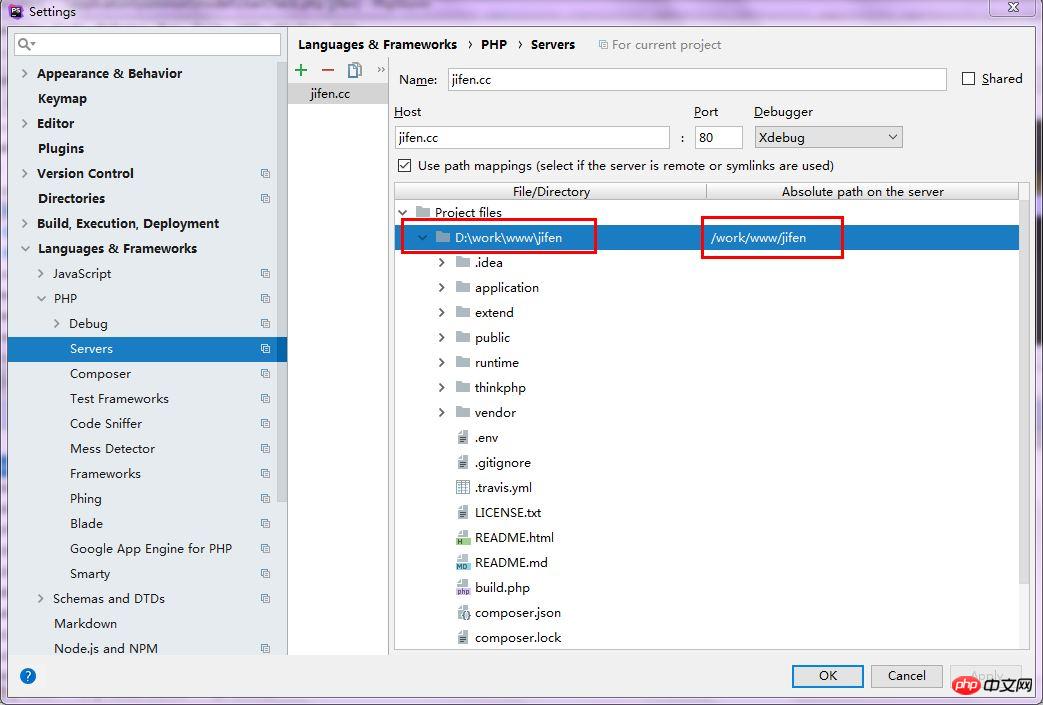
2. When monitoring remote code, if the host and code If the directory structure is consistent, the monitoring will be successful directly. Otherwise, you will be prompted to set the code mapping relationship. You can also set it manually:

Here, because the host is Windows and the code is in Linux, the directories are inconsistent and mapping is done. Otherwise the breakpoint will fail.
The above is the entire content of this article. I hope it will be helpful to everyone's study. I also hope that everyone will support the php Chinese website.
Articles you may be interested in:
php strftime function to get date and time php basics
PHP multi-dimensional array specifies multi-field sorting example code_php example
The above is the detailed content of Phpstorm+Xdebug breakpoint debugging PHP method php example. For more information, please follow other related articles on the PHP Chinese website!

