Home >Backend Development >PHP Tutorial >ThinkPHP debugging mode and logging overview
ThinkPHP debugging mode and logging overview
- 不言Original
- 2018-06-06 14:31:271748browse
This article mainly introduces the usage of ThinkPHP debugging mode and logging. Friends who need it can refer to it
This article describes the usage of ThinkPHP debugging mode and logging. This function is used in ThinkPHP projects. It plays a very important role in the development process and must be understood and mastered. The specific method is as follows:
1. It can be set in config.php, and the default is closed.
The opening method is as follows:
'APP_DEBUG' => true
Open the \ThinkPHP\Common\debug.php file to view the default settings of debug as follows:
return array(
  'LOG_RECORD'=>true, // 进行日志记录
  'LOG_RECORD_LEVEL'    =>  array('EMERG','ALERT','CRIT','ERR','WARN','NOTIC','INFO','DEBUG','SQL'), // 允许记录的日志级别
  'DB_FIELDS_CACHE'=> false, //数据库字段缓存
  'SHOW_RUN_TIME'=>true,     // 运行时间显示
  'SHOW_ADV_TIME'=>true,     // 显示详细的运行时间
  'SHOW_DB_TIMES'=>true,     // 显示数据库查询和写入次数
  'SHOW_CACHE_TIMES'=>true,    // 显示缓存操作次数
  'SHOW_USE_MEM'=>true,      // 显示内存开销
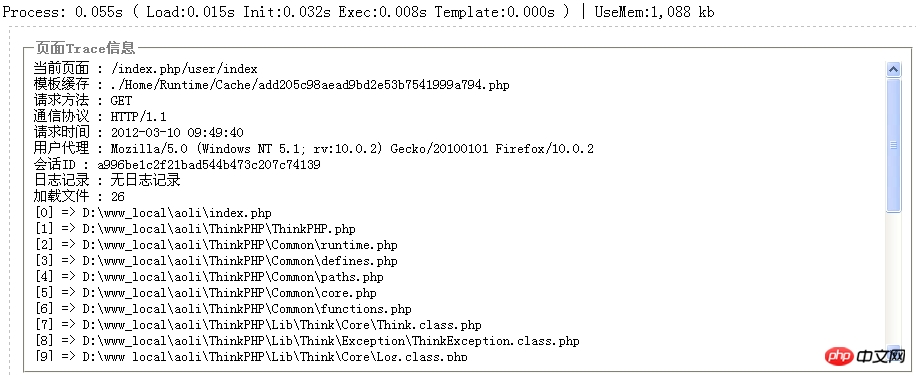
  'SHOW_PAGE_TRACE'=>true,    // 显示页面Trace信息 由Trace文件定义和Action操作赋值
  'APP_FILE_CASE' =>  true, // 是否检查文件的大小写 对Windows平台有效
);
Note: DB_FIELDS_CACHE database field cache is turned off by default. If it is turned on, a file cache will be generated in the Runtime\Data folder, and after the table is modified , if a new field is added, this cache cannot record your operations. We need to manually delete it once before the table modification can be successful.
After setting 'APP_DEBUG' => true, the DEBUG prompt as shown below will appear on the access page:

If you only want to display part of the prompt information, such as Running time, memory overhead, etc.,
can be set accordingly in config.php, such as:
//'APP_DEBUG'  => true, // 调试模式开关
'SHOW_RUN_TIME' => true, //运行时间显示
'SHOW_ADV_TIME' => true, //显示详细的运行时间
'SHOW_DB_TIMES' => true, //显示数据库的操作次数
'SHOW_CACHE_TIMES'=>true, //显示缓存操作次数
'SHOW_USE_MEM' => true, //显示内存开销
The prompt information is as follows Picture:

2. Customization of page Trace information: \ThinkPHP\Tpl\PageTrace.tpl.php
Customization Method one: Add a trace.php file in the same directory as config.php, the code is as follows:
<?php
return array{
'当前的server信息'=>$_SERVER['REMOTE_ADDR'],
};
?>
Customized method two: In Action Add in the method:
$this->trace('调试测试','5211314');
3. Output debugging method:
halt('aaaaaaa');//输出aaaaaa并且中断程序执行
4. Model debugging: display SQL statements
 $User=new Model('User');
 $User->find(1);
 echo $User->getLastSql();//输出最后执行的一条SQL语句
5, logging\ThinkPHP\Lib\Think\Core\Log.class.php
config Set
 'LOG_RECORD'=>true,//开启了日志记录
 'LOG_RECORD_LEVEL'=>array('EMERG','ALERT','ERROR'),
in .php. Related recommendations:
Customized error page in ThinkPHP And prompt page
How to set up a custom directory structure in ThinkPHP
The above is the detailed content of ThinkPHP debugging mode and logging overview. For more information, please follow other related articles on the PHP Chinese website!

