Home >Backend Development >Python Tutorial >Python uses the pylab library to implement the histogram drawing function
Python uses the pylab library to implement the histogram drawing function
- 不言Original
- 2018-06-02 14:54:532225browse
This article mainly introduces Python's use of the pylab library to realize the function of drawing histograms. It analyzes Python data reading, traversal and related operation skills of drawing histograms based on the pylab library in the form of examples. Friends in need can refer to the following
The example in this article describes how Python uses the pylab library to implement the histogram drawing function. Share it with everyone for your reference, the details are as follows:
Python histogram
#!/usr/bin/python
# -*- coding: utf-8 -*-
import pylab as pl
dataFile = "dataList.txt"
tempList = []
with open(dataFile,"r") as data:
  for everLine in data:
    arrEverLine = [float(index) for index in everLine.split()]
    tempList.append(arrEverLine[0])
pl.hist(tempList,100)
pl.xlabel("直方图标题", fontproperties='SimHei')
pl.show()
dataList.txt content
14 2 1 0.5 0.5 0 1 0.5 1.5 18.5
19 2 2 0.5 1 0 1 0.5 0 21
19.5 2 1.5 2 0 0.5 2 0 1 20
17.5 1.5 1 1.5 2 0 1.5 0 0 18.5
19.5 2 2 2 0.5 0 1 0 0.5 19.5
16.5 2 0.5 1 0 0.5 0.5 0 0.5 19.5
15.5 2 1 1.5 0 0 1 0.5 1 17.5
13.5 1.5 1 1 2 0 2 0.5 2 20
14.5 2 1.5 2 0 0 1 0 2 18.5
16 2 2 1.5 1 0.5 1 0 2 19.5
。。。
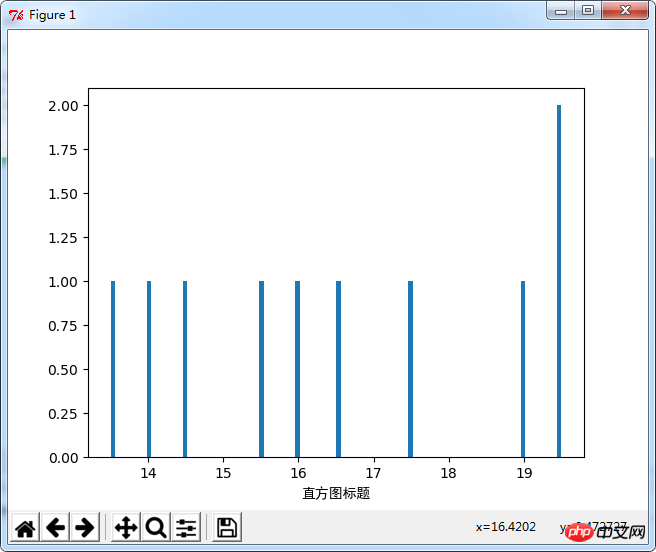
Output result

The above is the detailed content of Python uses the pylab library to implement the histogram drawing function. For more information, please follow other related articles on the PHP Chinese website!

