

Detailed explanation of using Node debugging tools
This time I will bring you a detailed explanation of the use of the Node debugging tool. What are the precautions of the Node debugging tool? The following is a practical case, let's take a look.

In 2016, Node decided to use the "Developer Tools" of the Chrome browser as the official debugging tool, so that Node scripts can also be debugged using the graphical interface, which is greatly convenient. Developer.
This article introduces how to use the debugging tool of Node script.
1. Sample program
For the convenience of explanation, the following is a sample script. First, create a new working directory and enter it.
$ mkdir debug-demo
$ cd debug-demo
Then, generate the package.json file and install the Koa framework and koa-route module.
$ npm init -y
$ npm install --save koa koa-route
Next, create a new script app.js and write the following content.
// app.js
const Koa = require('koa');
const router = require('koa-route');
const app = new Koa();
const main = ctx => {
ctx.response.body = 'Hello World';
};
const welcome = (ctx, name) => {
ctx.response.body = 'Hello ' + name;
};
app.use(router.get('/', main));
app.use(router.get('/:name', welcome));
app.listen(3000);
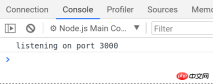
console.log('listening on port 3000');
The above code is a simple Web application that specifies two routes. After access, a line of welcome information will be displayed. If you want to know the detailed meaning of the code in detail, you can refer to the Koa tutorial.
2. Start the developer tools
Now, run the above script.
$ node --inspect app.js
In the above code, the --inspect parameter is required to start the debug mode. At this time, open the browser and visit http://127.0.0.1//3000, and you can see Hello World.

Next, it’s time to start debugging. There are two ways to open the debugging tool. The first is to type chrome://inspect or about:inspect in the address bar of the Chrome browser and press Enter. See the interface below.

In the Target section, click the inspect link to enter the debugging tool.
The second way to enter the debugging tool is to open the "Developer Tools" in the window at http://127.0.0.1//3000. There is a green Node logo in the upper left corner of the top. Click to enter. .

3. Debugging Tool Window
The debugging tool is actually a customized version of the "Developer Tools" , leaving out those parts that are not useful for server scripts.
It mainly has four panels.
Console:Console
Memory:Memory
Profiler:Performance
Sources: Source code
The usage of these panels is basically similar to the browser environment. Only Sources is introduced here ( Source code) panel.
4. Set breakpoints
Enter the Sources panel and find the running script app.js.

Click on the line number of line 11 (that is, the line below) to set a breakpoint.
ctx.response.body = 'Hello ' + name;

At this time, when the browser accesses http://127.0.0.1:3000/alice, the page will show that it is waiting for the server to return. Switch to the debugging tool and you can see that the Node main thread is in the paused stage.

Enter the Console panel, enter name, and alice will be returned. This indicates that we are in the context of the breakpoint.

再切回 Sources 面板,右侧可以看到 Watch、Call Stack、Scope、Breakpoints 等折叠项。打开 Scope 折叠项,可以看到 Local 作用域和 Global 作用域里面的所有变量。
Local 作用域里面,变量 name 的值是 alice ,双击进入编辑状态,把它改成 bob 。

然后,点击顶部工具栏的继续运行按钮。

页面上就可以看到 Hello bob 了。

命令行下,按下 ctrl + c,终止运行 app.js 。
五、调试非服务脚本
Web 服务脚本会一直在后台运行,但是大部分脚本只是处理某个任务,运行完就会终止。这时,你可能根本没有时间打开调试工具。等你打开了,脚本早就结束运行了。这时怎么调试呢?
$ node --inspect=9229 -e "setTimeout(function() { console.log('yes'); }, 30000)"
上面代码中, --inspect=9229 指定调试端口为 9229,这是调试工具默认的通信端口。 -e 参数指定一个字符串,作为代码运行。
访问 chrome://inspect ,就可以进入调试工具,调试这段代码了。

代码放在 setTimeout 里面,总是不太方便。那些运行时间较短的脚本,可能根本来不及打开调试工具。这时就要使用下面的方法。
$ node --inspect-brk=9229 app.js
上面代码中, --inspect-brk 指定在第一行就设置断点。也就是说,一开始运行,就是暂停的状态。
六、忘了写 --inspect 怎么办?
打开调试工具的前提是,启动 Node 脚本时就加上 --inspect 参数。如果忘了这个参数,还能不能调试呢?
回答是可以的。首先,正常启动脚本。
$ node app.js
然后,在另一个命令行窗口,查找上面脚本的进程号。
$ ps ax | grep app.js
30464 pts/11  Sl+  0:00 node app.js
30541 pts/12  S+   0:00 grep app.js
上面命令中, app.js 的进程号是 30464 。
接着,运行下面的命令。
$ node -e 'process._debugProcess(30464)'
上面命令会建立进程 30464 与调试工具的连接,然后就可以打开调试工具了。
还有一种方法,就是向脚本进程发送 SIGUSR1 信号,也可以建立调试连接。
$ kill -SIGUSR1 30464
相信看了本文案例你已经掌握了方法,更多精彩请关注php中文网其它相关文章!
推荐阅读:
The above is the detailed content of Detailed explanation of using Node debugging tools. For more information, please follow other related articles on the PHP Chinese website!

 Python vs. JavaScript: A Comparative Analysis for DevelopersMay 09, 2025 am 12:22 AM
The main difference between Python and JavaScript is the type system and application scenarios. 1. Python uses dynamic types, suitable for scientific computing and data analysis. 2. JavaScript adopts weak types and is widely used in front-end and full-stack development. The two have their own advantages in asynchronous programming and performance optimization, and should be decided according to project requirements when choosing.
 Python vs. JavaScript: Choosing the Right Tool for the JobMay 08, 2025 am 12:10 AM
Whether to choose Python or JavaScript depends on the project type: 1) Choose Python for data science and automation tasks; 2) Choose JavaScript for front-end and full-stack development. Python is favored for its powerful library in data processing and automation, while JavaScript is indispensable for its advantages in web interaction and full-stack development.
 Python and JavaScript: Understanding the Strengths of EachMay 06, 2025 am 12:15 AM
Python and JavaScript each have their own advantages, and the choice depends on project needs and personal preferences. 1. Python is easy to learn, with concise syntax, suitable for data science and back-end development, but has a slow execution speed. 2. JavaScript is everywhere in front-end development and has strong asynchronous programming capabilities. Node.js makes it suitable for full-stack development, but the syntax may be complex and error-prone.
 JavaScript's Core: Is It Built on C or C ?May 05, 2025 am 12:07 AM
JavaScriptisnotbuiltonCorC ;it'saninterpretedlanguagethatrunsonenginesoftenwritteninC .1)JavaScriptwasdesignedasalightweight,interpretedlanguageforwebbrowsers.2)EnginesevolvedfromsimpleinterpreterstoJITcompilers,typicallyinC ,improvingperformance.
 JavaScript Applications: From Front-End to Back-EndMay 04, 2025 am 12:12 AM
JavaScript can be used for front-end and back-end development. The front-end enhances the user experience through DOM operations, and the back-end handles server tasks through Node.js. 1. Front-end example: Change the content of the web page text. 2. Backend example: Create a Node.js server.
 Python vs. JavaScript: Which Language Should You Learn?May 03, 2025 am 12:10 AM
Choosing Python or JavaScript should be based on career development, learning curve and ecosystem: 1) Career development: Python is suitable for data science and back-end development, while JavaScript is suitable for front-end and full-stack development. 2) Learning curve: Python syntax is concise and suitable for beginners; JavaScript syntax is flexible. 3) Ecosystem: Python has rich scientific computing libraries, and JavaScript has a powerful front-end framework.
 JavaScript Frameworks: Powering Modern Web DevelopmentMay 02, 2025 am 12:04 AM
The power of the JavaScript framework lies in simplifying development, improving user experience and application performance. When choosing a framework, consider: 1. Project size and complexity, 2. Team experience, 3. Ecosystem and community support.
 The Relationship Between JavaScript, C , and BrowsersMay 01, 2025 am 12:06 AM
Introduction I know you may find it strange, what exactly does JavaScript, C and browser have to do? They seem to be unrelated, but in fact, they play a very important role in modern web development. Today we will discuss the close connection between these three. Through this article, you will learn how JavaScript runs in the browser, the role of C in the browser engine, and how they work together to drive rendering and interaction of web pages. We all know the relationship between JavaScript and browser. JavaScript is the core language of front-end development. It runs directly in the browser, making web pages vivid and interesting. Have you ever wondered why JavaScr


Hot AI Tools

Undresser.AI Undress
AI-powered app for creating realistic nude photos

AI Clothes Remover
Online AI tool for removing clothes from photos.

Undress AI Tool
Undress images for free

Clothoff.io
AI clothes remover

Video Face Swap
Swap faces in any video effortlessly with our completely free AI face swap tool!

Hot Article
Hot Tools

Atom editor mac version download
The most popular open source editor

SAP NetWeaver Server Adapter for Eclipse
Integrate Eclipse with SAP NetWeaver application server.

PhpStorm Mac version
The latest (2018.2.1) professional PHP integrated development tool

SublimeText3 Chinese version
Chinese version, very easy to use

SublimeText3 Linux new version
SublimeText3 Linux latest version

