Home >Backend Development >Python Tutorial >Draw commonly used charts using python
Draw commonly used charts using python
- 不言Original
- 2018-04-24 14:58:436828browse
This article introduces how to use Python to draw different charts based on Excel table data. It is very detailed. Friends who have the same needs can refer to it.
This article introduces how to use Python to summarize commonly used Charts, compared with the click-and-click operation of Excel, drawing charts with python seems more cumbersome, especially in the processing of original data. However, the two have roughly the same idea in the process of drawing charts. Most of the work that can be done in Excel can also be done by python. In order to explain more clearly the process of drawing charts using python, we annotate the code of the summary chart to explain the specific function of each line of code. At the end of the article, a corresponding table of custom fonts and chart colors is given.

Preparation
import numpy as np
import pandas as pd
#导入图表库以进行图表绘制
import matplotlib.pyplot as plt
loandata=pd.DataFrame(pd.read_excel('loan_data.xlsx'))
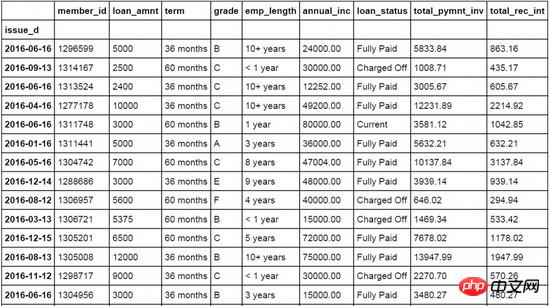
Line chart
#设置日期字段issue_d为loandata数据表索引字段
loandata = loandata.set_index('issue_d')
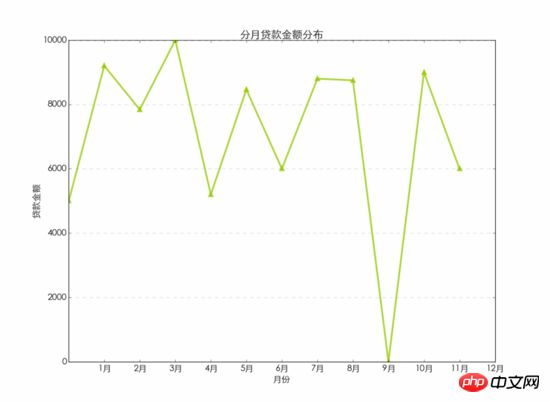
#按月对贷款金额loan_amnt求均值,以0填充空值
loan_plot=loandata['loan_amnt'].resample('M').fillna(0)
#图表字体为华文细黑,字号为15
plt.rc('font', family='STXihei', size=15)
#创建一个一维数组赋值给a
a=np.array([1,2,3,4,5,6,7,8,9,10,11,12])
#创建折线图,数据源为按月贷款均值,标记点,标记线样式,线条宽度,标记点颜色和透明度
plt.plot(loan_plot,'g^',loan_plot,'g-',color='#99CC01',linewidth=3,markeredgewidth=3,markeredgecolor='#99CC01',alpha=0.8)
#添加x轴标签
plt.xlabel('月份')
#添加y周标签
plt.ylabel('贷款金额')
#添加图表标题
plt.title('分月贷款金额分布')
#添加图表网格线,设置网格线颜色,线形,宽度和透明度
plt.grid( color='#95a5a6',linestyle='--', linewidth=1 ,axis='y',alpha=0.4)
#设置数据分类名称
plt.xticks(a, ('1月','2月','3月','4月','5月','6月','7月','8月','9月','10月','11月','12月') )
#输出图表
plt.show()
Bar chart
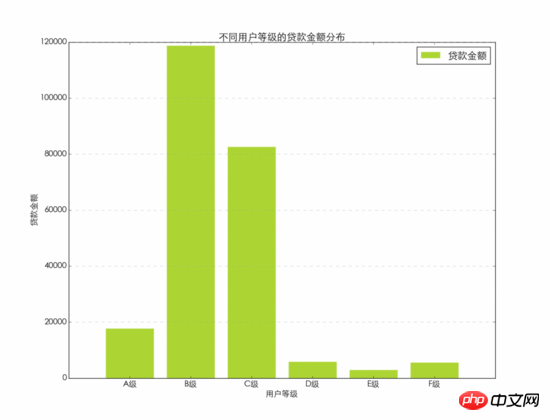
#按用户等级grade字段对贷款金额进行求和汇总
loan_grade=loandata.groupby('grade')['loan_amnt'].agg(sum)
#图表字体为华文细黑,字号为15
plt.rc('font', family='STXihei', size=15)
#创建一个一维数组赋值给a
a=np.array([1,2,3,4,5,6])
#创建柱状图,数据源为按用户等级汇总的贷款金额,设置颜色,透明度和外边框颜色
plt.bar([1,2,3,4,5,6],loan_grade,color='#99CC01',alpha=0.8,align='center',edgecolor='white')
#设置x轴标签
plt.xlabel('用户等级')
#设置y周标签
plt.ylabel('贷款金额')
#设置图表标题
plt.title('不同用户等级的贷款金额分布')
#设置图例的文字和在图表中的位置
plt.legend(['贷款金额'], loc='upper right')
#设置背景网格线的颜色,样式,尺寸和透明度
plt.grid(color='#95a5a6',linestyle='--', linewidth=1,axis='y',alpha=0.4)
#设置数据分类名称
plt.xticks(a,('A级','B级','C级','D级','E级','F级'))
#显示图表
plt.show()
##Bar chart
#图表字体为华文细黑,字号为15
plt.rc('font', family='STXihei', size=15)
#创建一个一维数组赋值给a
a=np.array([1,2,3,4,5,6])
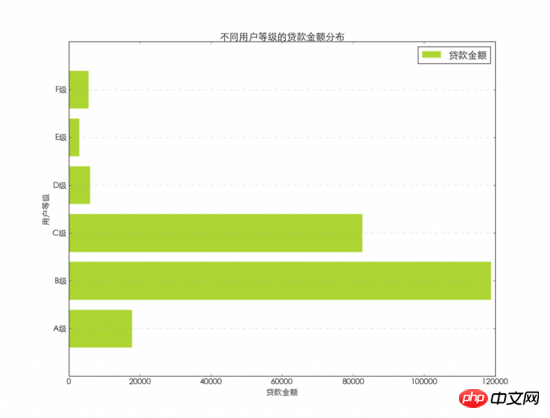
#创建条形图,数据源为分等级贷款金额汇总,设置颜色,透明度和图表边框
plt.barh([1,2,3,4,5,6],loan_grade,color='#99CC01',alpha=0.8,align='center',edgecolor='white')
#添加x轴标题
plt.xlabel('贷款金额')
#添加y轴标题
plt.ylabel('用户等级')
#添加图表标题
plt.title('不同用户等级的贷款金额分布')
#添加图例,并设置在图表中的显示位置
plt.legend(['贷款金额'], loc='upper right')
#设置背景网格线的颜色,样式,尺寸和透明度
plt.grid(color='#95a5a6',linestyle='--', linewidth=1,axis='y',alpha=0.4)
#设置数据分类名称
plt.yticks(a,('A级','B级','C级','D级','E级','F级'))
#显示图表
plt.show()
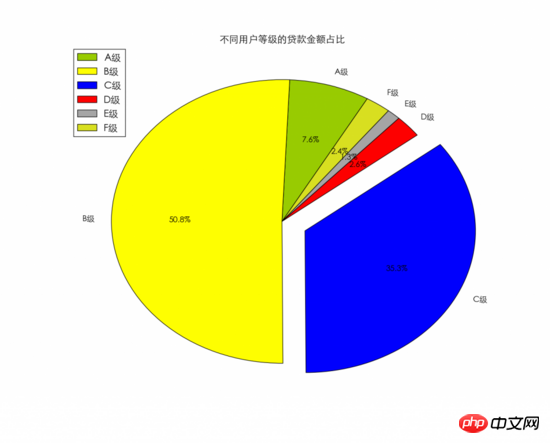
#图表字体为华文细黑,字号为15
plt.rc('font', family='STXihei', size=15)
#设置饼图中每个数据分类的颜色
colors = ["#99CC01","#FFFF01","#0000FE","#FE0000","#A6A6A6","#D9E021"]
#设置饼图中每个数据分类的名称
name=['A级', 'B级', 'C级', 'D级', 'E级','F级']
#创建饼图,设置分类标签,颜色和图表起始位置等
plt.pie(loan_grade,labels=name,colors=colors,explode=(0, 0, 0.15, 0, 0, 0),startangle=60,autopct='%1.1f%%')
#添加图表标题
plt.title('不同用户等级的贷款金额占比')
#添加图例,并设置显示位置
plt.legend(['A级','B级','C级','D级','E级','F级'], loc='upper left')
#显示图表
plt.show()
#按月汇总贷款金额,以0填充空值
loan_x=loandata['loan_amnt'].resample('M',how=sum).fillna(0)
#按月汇总利息金额,以0填充空值
loan_y=loandata['total_rec_int'].resample('M',how=sum).fillna(0)
#图表字体为华文细黑,字号为15
plt.rc('font', family='STXihei', size=15)
#创建散点图,贷款金额为x,利息金额为y,设置颜色,标记点样式和透明度等
plt.scatter(loan_x,loan_y,60,color='white',marker='o',edgecolors='#0D8ECF',linewidth=3,alpha=0.8)
#添加x轴标题
plt.xlabel('贷款金额')
#添加y轴标题
plt.ylabel('利息收入')
#添加图表标题
plt.title('贷款金额与利息收入')
#设置背景网格线的颜色,样式,尺寸和透明度
plt.grid(color='#95a5a6',linestyle='--', linewidth=1,axis='both',alpha=0.4)
#显示图表
plt.show()
#按月汇总贷款金额及利息
loan_x=loandata['loan_amnt'].resample('M',how=sum).fillna(0)
loan_y=loandata['total_rec_int'].resample('M',how=sum).fillna(0)
loan_z=loandata['total_rec_int'].resample('M',how=sum).fillna(0)
#图表字体为华文细黑,字号为15
plt.rc('font', family='STXihei', size=15)
#设置气泡图颜色
colors = ["#99CC01","#FFFF01","#0000FE","#FE0000","#A6A6A6","#D9E021",'#FFF16E','#0D8ECF','#FA4D3D','#D2D2D2','#FFDE45','#9b59b6']
#创建气泡图贷款金额为x,利息金额为y,同时设置利息金额为气泡大小,并设置颜色透明度等。
plt.scatter(loan_x,loan_y,s=loan_z,color=colors,alpha=0.6)
#添加x轴标题
plt.xlabel('贷款金额')
#添加y轴标题
plt.ylabel('利息收入')
#添加图表标题
plt.title('贷款金额与利息收入')
#设置背景网格线的颜色,样式,尺寸和透明度
plt.grid(color='#95a5a6',linestyle='--', linewidth=1,axis='both',alpha=0.4)
#显示图表
plt.show()
#图表字体为华文细黑,字号为15
plt.rc('font', family='STXihei', size=15)
#创建箱线图,数据源为贷款来源,设置横向显示
plt.boxplot(loandata['loan_amnt'],1,'rs',vert=False)
#添加x轴标题
plt.xlabel('贷款金额')
#添加图表标题
plt.title('贷款金额分布')
#设置背景网格线的颜色,样式,尺寸和透明度
plt.grid(color='#95a5a6',linestyle='--', linewidth=1,axis='both',alpha=0.4)
#显示图表
plt.show()
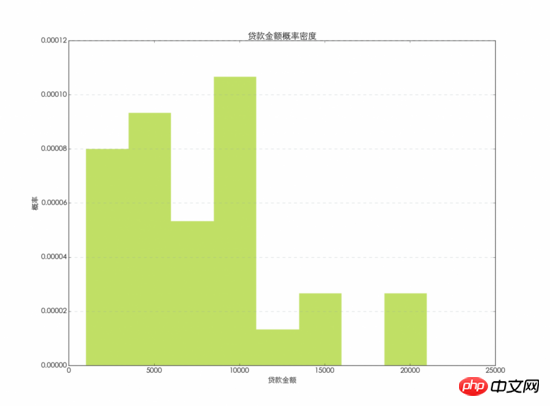
 ##Histogram
#图表字体为华文细黑,字号为15
plt.rc('font', family='STXihei', size=15)
#创建直方图,数据源为贷款金额,将数据分为8等份显示,设置颜色和显示方式,透明度等
plt.hist(loandata['loan_amnt'],8,normed=1, histtype='stepfilled',facecolor='#99CC01', rwidth=0.9,alpha=0.6,edgecolor='white')
#添加x轴标题
plt.xlabel('贷款金额')
#添加y轴标题
plt.ylabel('概率')
#添加图表标题
plt.title('贷款金额概率密度')
#设置背景网格线的颜色,样式,尺寸和透明度
plt.grid(color='#95a5a6',linestyle='--', linewidth=1,axis='y',alpha=0.4)
#显示图表
plt.show()
 Custom fonts and colors
used in charts Font, you can use the following font name to replace the content after family= to change the font displayed in the chart.
For the colors in the chart, you can use the color name directly, or you can use the abbreviation to set the color used in the chart. This article does not use the default color, but uses Custom colors. 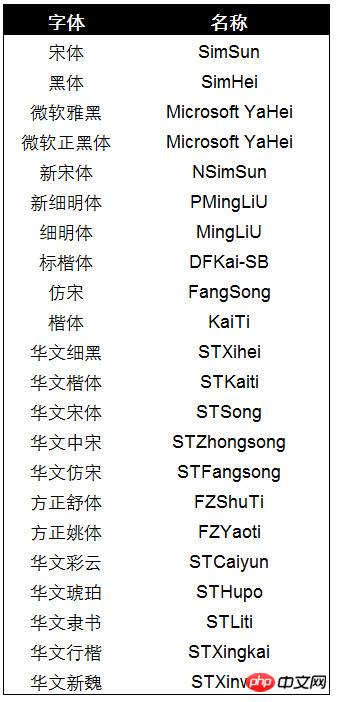
The color number of custom colors. The Hex color number is used in this article. The corresponding relationship between Hex and RGB, as well as the corresponding colors, are given below. You can use the Hex color numbers below to replace the colors of the charts in this article. 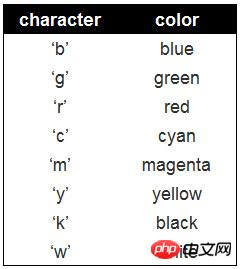
Related recommendations: 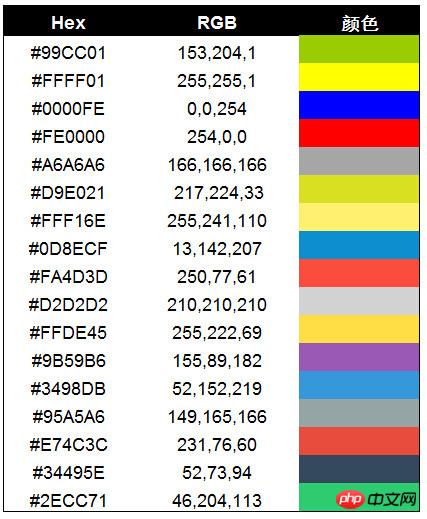
How to use python to draw a line chart
Use python to draw graphics Detailed explanation of examples
The above is the detailed content of Draw commonly used charts using python. For more information, please follow other related articles on the PHP Chinese website!

