


虽然网上已经有多的数不清的调试教程了,但仍然没有发现哪篇文章写的通俗易懂,索性自己尝试写写自己的一些使用习惯或者说是心得,希望对那些还不是很懂得使用断点调试的孩子有一些帮助(大神请无视~)。
1. What is breakpoint debugging? Is it difficult?
Breakpoint debugging is actually not that complicated. A simple understanding of no outbound calls is to open the browser, open sources, find the js file, and click on the line number. It seems very simple to operate, but in fact many people struggle with where to break the point? (Let’s look at a breakpoint screenshot first, taking the breakpoint of the Chrome browser as an example)

Do you remember the steps?
Open the page with chrome browser → Press f12 to open the developer tools → Open Sources → Open the js code file you want to debug → Click on the line number, OK! Congratulations on your virgin breakpoint. ,Haha~~
2. How to set breakpoints appropriately?
The operation of breaking points is very simple. The core question is, how to set breakpoints to find out the problems in the code? Let me continue to give an example for everyone to understand. Without further ado, the picture above:

Assume that we are now implementing a function of loading more, as shown in the picture above, but now There was a problem loading more functions. The data was not loaded after clicking. What should we think of first at this time? (Write the answer on a different line, so you can see what your first reaction is)
The first thing I thought of was, was my click successful? Are the methods in the click event run? Okay, if we want to know the answer to this question, let's try setting a breakpoint immediately. Where is the breakpoint? Think about it yourself first.
Continue with the picture above:
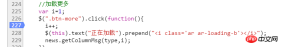
Have you thought about it? That's right, since we want to know whether the click is successful, of course we add a breakpoint at the click event in the code. Remember not to add it on line 226, because the function in the click method is executed, not the selection on line 226. device. The breakpoint is now set, what do you do next? Think about it for yourself~
Continue with the above picture:

Then of course we go back and click the load more button, why? Forehead. . . If you ask, please allow me to use this emoticon  . How can I trigger a click event without clicking the load more button? How to execute the function in the click event without triggering the click event? Roaring. . But I believe that everyone will not ask such a low question~ No nonsense~
Let’s continue with the topic. The picture above is the situation after clicking the load more button. We can see that the page on the left is divided by one and a half The transparent layer is covered, and there is a string of English and two buttons at the top of the page. The 227th line of code on the right is added with a background color. When this happens, regardless of what the English meaning of those buttons is and what effect they have, you start from this What information does the picture get? Continue to think about it~
If the above situation occurs, it means that the function in the click event is called, which further illustrates that the click event takes effect. Then our first "criminal suspect" for this problem has been eliminated.
To add:
What should I do if the above situation does not occur? Does that mean that the click event did not take effect? So what causes the click event not to take effect? Think about it for yourself~
There are many reasons that may cause the click event not to take effect, such as multiple selector errors, syntax errors, the selected element is generated later, etc. How to solve it?
Selector error, you can continue to see the content of the console part, I think you will know how to deal with it
Grammar error, check it carefully, unfamiliar grammar can be compared with Baidu
The selected element is generated later. The simplest processing is to use the .on() method to process it. This stuff has event delegation processing. You can Baidu for details.
So where will the identity of the "criminal suspect" be locked next?
We turn our attention to the inside of the event. The click event is triggered, so the next problem is its internal function problem. If you want to ask why? Please give me a piece of tofu. . .
For example, I give you a pen and ask you to write. Then you write a word on the paper and find that the word does not come out. Why? You said I wrote it, but there are still scratches on the paper. Is it possible that the pen is out of ink or the nib is broken? This example is more similar to click loading. The action of writing is a click operation, and the internal function is the ink or pen tip. Do you understand~
Then let’s analyze the content of the click event, which contains three sentences. The first sentence is to increase the variable i automatically, the second sentence is to add an i label to the button, and the third sentence is to add an i label to the button. Sentence is a method called to request data.
Through the functions of these three sentences, we can place a larger part of the suspicion on the third sentence, and a smaller part on the first and second sentences. Some people may be confused, the second sentence How could his words be suspicious? Its function is just to add a label, which has no impact on the data at all. Indeed, this sentence has no impact on the data, but for strict consideration, it may still make mistakes. For example, what if it is missing a semicolon? Or is there a wrong symbol inside the sentence? It's often small problems like this that waste a lot of our time.
Okay, in order to further target the "criminal suspect", I would like to introduce a tool to you, which is also one of the two icons that appear in the above picture, see the picture below:

The function of this small icon is called "statement-by-statement execution" or "step-by-step execution". This is a term that I personally understand. It means that every time you click it, the js statement will execute one sentence later. It also has A shortcut key, F10. The following picture demonstrates the effect after it is clicked:

I clicked this button twice (or used the F10 shortcut key), and the js code was executed from line 227 to line 229 OK, so I call it "statement-by-statement execution" or "step-by-step execution". This function is very practical and will be used in most debugging.
OK, keep writing!
As mentioned above, I clicked the "Execute statement by statement" button twice, and the code ran from line 227 to line 229. What do you think this means? Does this mean that grammatically speaking, the first two sentences are correct? Does it also mean that the first two sentences eliminate suspicion? I don't think so.
As we all know, loading more is a function of the next page, and the most important one is the page number value passed to the background. Whenever I click the load more button, the page number value will be Add 1, so if the data on the next page does not come out, is it possible that there is a problem with the page number value, which is the [i variable] (hereinafter referred to as i)? So how to check whether there is a problem with the page number? Let’s all think about it ourselves first.
The following will teach you two ways to view the actual output value of the page number i], the picture above:
The first way:

The operation steps are as follows:
1. Still set a breakpoint on line 227 → 2. Click the Load more button → 3. Click the "Execute statement by statement" button once, and the js code will be executed to line 228 → 4. Use the mouse to select i++ (you don’t understand what selecting means? It means you want to copy something, do you want to select it? Yes, this is the selection) → 5. After selecting, hover the mouse over the target, and you will see the picture above the result of.
The second method:

This method is actually similar to the first method, except that it outputs the value of i on the console. You only need to follow the steps One method is to go to the third step → 4. Open the console at the same level as sources → 5. Enter i in the input field below the console → 6. Press the enter key.
In the second method above, the console is mentioned. We can call it the console or anything else. It doesn’t matter. The function of the console is very powerful. During the debugging process, we It is often necessary to know what the values of certain variables are output, or whether we have selected the element we want using a selector [$”.p”), etc., etc., which can be printed on the console. Of course, you can also use the first method directly.
Let me show you how to print the elements we want to select in the console. Above~

#Enter $(this) in the console to get the selected element. Yes, it is the object we clicked - the load more button element.
Here I will tell you about my understanding of the console: This thing is a js parser, which is used by the browser itself to parse and run js, but the browser allows us to use the console Developers can control the execution and output of js during the debugging process. Through the above two methods, you may think it is very simple to use, but I want to remind you, or it may be a confusion that some novices are more likely to encounter.
Confusion 1: When there is no break point, enter i in the console, and the console reports an error.
This should be a very common question for novices. Why can't I directly output the value of the variable on the console without breaking the point? Personally, I understand that i is just a local variable at this time. If you do not set a breakpoint, the browser will parse all the js. The console cannot access local variables, but only global variables, so at this time the console will report an error that i is not available. Definition, but when js sets a breakpoint, the console resolves to the function where the local variable i is located, and i can be accessed at this time.
Confusion 2: Why can things be printed when I directly enter $(".xxx") in the console?
It's very simple. The console itself is a js parser, and $(".xxx") is a js statement, so naturally the console can parse this statement and output the result.
After introducing the usage of the "Statement-by-Statement Execution" button and the console, I will finally introduce a button, as shown in the picture above:

I call this button It is the "Execute step by step" button, which is different from the "Execute step by statement" button. The "Execute step by step" button is often used when one method calls multiple js files, and the js code involved is relatively long, then this button will be used.
Above picture:

Assume that in the above picture I only set a breakpoint on line 227, and then kept clicking the "Execute Statement by Statement" button to line 229, At this time, if you click the "Execute statement by statement" button again, you will enter the js in the picture below:


Must-see js breakpoint debugging experience. Share
How to use js for breakpoint debugging?
Discuss several methods of php breakpoint debugging
The above is the detailed content of JS breakpoint debugging example explanation. For more information, please follow other related articles on the PHP Chinese website!

 Python vs. JavaScript: A Comparative Analysis for DevelopersMay 09, 2025 am 12:22 AM
The main difference between Python and JavaScript is the type system and application scenarios. 1. Python uses dynamic types, suitable for scientific computing and data analysis. 2. JavaScript adopts weak types and is widely used in front-end and full-stack development. The two have their own advantages in asynchronous programming and performance optimization, and should be decided according to project requirements when choosing.
 Python vs. JavaScript: Choosing the Right Tool for the JobMay 08, 2025 am 12:10 AM
Whether to choose Python or JavaScript depends on the project type: 1) Choose Python for data science and automation tasks; 2) Choose JavaScript for front-end and full-stack development. Python is favored for its powerful library in data processing and automation, while JavaScript is indispensable for its advantages in web interaction and full-stack development.
 Python and JavaScript: Understanding the Strengths of EachMay 06, 2025 am 12:15 AM
Python and JavaScript each have their own advantages, and the choice depends on project needs and personal preferences. 1. Python is easy to learn, with concise syntax, suitable for data science and back-end development, but has a slow execution speed. 2. JavaScript is everywhere in front-end development and has strong asynchronous programming capabilities. Node.js makes it suitable for full-stack development, but the syntax may be complex and error-prone.
 JavaScript's Core: Is It Built on C or C ?May 05, 2025 am 12:07 AM
JavaScriptisnotbuiltonCorC ;it'saninterpretedlanguagethatrunsonenginesoftenwritteninC .1)JavaScriptwasdesignedasalightweight,interpretedlanguageforwebbrowsers.2)EnginesevolvedfromsimpleinterpreterstoJITcompilers,typicallyinC ,improvingperformance.
 JavaScript Applications: From Front-End to Back-EndMay 04, 2025 am 12:12 AM
JavaScript can be used for front-end and back-end development. The front-end enhances the user experience through DOM operations, and the back-end handles server tasks through Node.js. 1. Front-end example: Change the content of the web page text. 2. Backend example: Create a Node.js server.
 Python vs. JavaScript: Which Language Should You Learn?May 03, 2025 am 12:10 AM
Choosing Python or JavaScript should be based on career development, learning curve and ecosystem: 1) Career development: Python is suitable for data science and back-end development, while JavaScript is suitable for front-end and full-stack development. 2) Learning curve: Python syntax is concise and suitable for beginners; JavaScript syntax is flexible. 3) Ecosystem: Python has rich scientific computing libraries, and JavaScript has a powerful front-end framework.
 JavaScript Frameworks: Powering Modern Web DevelopmentMay 02, 2025 am 12:04 AM
The power of the JavaScript framework lies in simplifying development, improving user experience and application performance. When choosing a framework, consider: 1. Project size and complexity, 2. Team experience, 3. Ecosystem and community support.
 The Relationship Between JavaScript, C , and BrowsersMay 01, 2025 am 12:06 AM
Introduction I know you may find it strange, what exactly does JavaScript, C and browser have to do? They seem to be unrelated, but in fact, they play a very important role in modern web development. Today we will discuss the close connection between these three. Through this article, you will learn how JavaScript runs in the browser, the role of C in the browser engine, and how they work together to drive rendering and interaction of web pages. We all know the relationship between JavaScript and browser. JavaScript is the core language of front-end development. It runs directly in the browser, making web pages vivid and interesting. Have you ever wondered why JavaScr


Hot AI Tools

Undresser.AI Undress
AI-powered app for creating realistic nude photos

AI Clothes Remover
Online AI tool for removing clothes from photos.

Undress AI Tool
Undress images for free

Clothoff.io
AI clothes remover

Video Face Swap
Swap faces in any video effortlessly with our completely free AI face swap tool!

Hot Article
Hot Tools

Dreamweaver Mac version
Visual web development tools

SublimeText3 Mac version
God-level code editing software (SublimeText3)

EditPlus Chinese cracked version
Small size, syntax highlighting, does not support code prompt function

MinGW - Minimalist GNU for Windows
This project is in the process of being migrated to osdn.net/projects/mingw, you can continue to follow us there. MinGW: A native Windows port of the GNU Compiler Collection (GCC), freely distributable import libraries and header files for building native Windows applications; includes extensions to the MSVC runtime to support C99 functionality. All MinGW software can run on 64-bit Windows platforms.

SecLists
SecLists is the ultimate security tester's companion. It is a collection of various types of lists that are frequently used during security assessments, all in one place. SecLists helps make security testing more efficient and productive by conveniently providing all the lists a security tester might need. List types include usernames, passwords, URLs, fuzzing payloads, sensitive data patterns, web shells, and more. The tester can simply pull this repository onto a new test machine and he will have access to every type of list he needs.

