

JS front-end graphical plug-in tool Gojs component

I have previously shared two articles about the front-end components of process drawing, using jsPlumb. This component itself is not bad. It is easy to use, easy to get started, and lightweight. However, after using it for a period of time, I found some shortcomings. For example, the component is not stable. When you first enter the page, the connection style is sometimes messed up. You need to refresh the page before you can Return to normal, and the wiring style is relatively simple, which can easily cause visual fatigue. In addition, the company has recently vigorously promoted the so-called "Industry 4.0". In addition to the increased requirements for automation control, the requirements for this graphical interface have also increased. Therefore, the effect of the simple jsPlumb component can no longer satisfy the growing company's business. Based on the above, I finally found the Gojs component, which has powerful effects and rich APIs. The only drawback is that this component is a paid component.
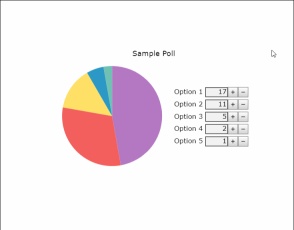
1. Preview of component effects
Let’s start with two cool effects


As far as the bottom two effects are concerned, they cannot be achieved by jsPlumb, but this effect is very attractive in the MES system, especially some process-related ones. Business, using this effect can make you feel taller at a glance. And at first glance, you don’t believe that this is the effect of a web page.
Other Effect Examples


2. First contact
#1. Introduction to Gojs
GoJS is a feature-rich JS library that can be used on web browsers and platforms Realize custom interaction diagrams and complex visualization effects. It uses custom templates and layout components to simplify complex JS diagrams such as nodes, links, and groups, and provides many advanced functions for user interaction, such as drag and drop, copy, paste, An extended tool system for text editing, tooltips, context menus, autolayout, templates, data binding and models, transaction state and undo management, palettes, overviews, event handlers, commands and custom actions. GoJS enables user interaction and runs completely in the browser, rendering HTML5 Canvas elements or SVG without having to switch servers or plugins, and without server-side requests. GoJS does not depend on any JS library or framework (such as bootstrap, jquery, etc.) and can work with any HTML or JS framework, or even without a framework.2. Getting started
(1) File referenceCopy code The code is as follows:
<script src="gojs/go-debug_ok.js"></script>You can use the latest version on the cdn, or you can reference the local downloaded file. If it is development, you can quote the debug version of js, and quote the official js when running officially. There is no need to say more about this. (2) Create canvasDefine any html element as our canvas
Copy code The code is as follows:
<p id="myDiagramp" style="margin:auto;width:300px; height:300px; background-color:#ddd;"></p>Then use the gojs api to initialize the canvas
//创建画布
  var objGo = go.GraphObject.make;
  var myDiagram = objGo(go.Diagram, "myDiagramp",
   {
    //模型图的中心位置所在坐标
    initialContentAlignment: go.Spot.Center,

    //允许用户操作图表的时候使用Ctrl-Z撤销和Ctrl-Y重做快捷键
    "undoManager.isEnabled": true,

    //不运行用户改变图表的规模
    allowZoom: false,

    //画布上面是否出现网格
    "grid.visible": true,

    //允许在画布上面双击的时候创建节点
    "clickCreatingTool.archetypeNodeData": { text: "Node" },

    //允许使用ctrl+c、ctrl+v复制粘贴
    "commandHandler.copiesTree": true,

    //允许使用delete键删除节点
    "commandHandler.deletesTree": true,

    // dragging for both move and copy
    "draggingTool.dragsTree": true,
   });
The official example uses the $ symbol as a variable. The blogger feels that the $ symbol is too sensitive, so let’s change the name~ The above parameters are selected by the blogger, and more For the parameters of multi-initialization canvas, please refer to the official API picture below:

(3)创建模型数据(Model)
接着上面的代码,我们增加如下几行
var myModel = objGo(go.Model);//创建Model对象
  // model中的数据每一个js对象都代表着一个相应的模型图中的元素
  myModel.nodeDataArray = [
   { key: "工厂" },
   { key: "车间" },
   { key: "工人" },
   { key: "岗位" },
  ];
  myDiagram.model = myModel; //将模型数据绑定到画布图上
效果预览

(4)创建节点(Node)
上面有了画布和节点数据,只是有了一个雏形,但是还没有任何的图形化效果。我们加入一些效果试试
在gojs里面给我们提供了几种模型节点的可选项:
Shape:形状——Rectangle(矩形)、RoundedRectangle(圆角矩形),Ellipse(椭圆形),Triangle(三角形),Diamond(菱形),Circle(圆形)等
TextBlock:文本域(可编辑)
Picture:图片
Panel:容器来保存其他Node的集合
默认的节点模型代码只是由一个TextBlock组件构建成
我们增加如下一段代码
// 定义一个简单的节点模板
  myDiagram.nodeTemplate =
   objGo(go.Node, "Horizontal",//横向布局的面板
    // 节点淡蓝色背景
    { background: "#44CCFF" },
    objGo(go.Shape,
     "RoundedRectangle", //定义形状,这是圆角矩形
     { /* Shape的参数。宽高颜色等等*/figure: "Club", width: 40, height: 60, margin: 4, fill: 'red' },
     // 绑定 Shape.figure属性为Node.data.fig的值,Model对象可以通过Node.data.fig 获取和设置Shape.figure(修改形状)
     new go.Binding("figure", "fig"), new go.Binding('fill', 'fill2')),
    objGo(go.TextBlock,
     "Default Text", // 默认文本
     // 设置字体大小颜色以及边距
     { margin: 12, stroke: "white", font: "bold 16px sans-serif" },
     //绑定TextBlock.text 属性为Node.data.name的值,Model对象可以通过Node.data.name获取和设置TextBlock.text
     new go.Binding("text", "name"))
   );

  var myModel = objGo(go.Model);//创建Model对象
  // model中的数据每一个js对象都代表着一个相应的模型图中的元素
  myModel.nodeDataArray = [
   { name: "工厂", fig: 'YinYang', fill2: 'blue' },
   { name: "车间", fig: 'Peace', fill2: 'red' },
   { name: "工人", fig: 'NotAllowed', fill2: 'green' },
   { name: "岗位", fig: 'Fragile', fill2: 'yellow' },
  ];
  myDiagram.model = myModel; //将模型数据绑定到画布图上
代码释疑:以上我们给画布对象定义了两种节点模板,一种是文本节点,另一种是形状节点(Node)。在形状节点中,我们定义了数据模型的通用节点样式,就是这一段代码{ /* Shape的参数。宽高颜色等等*/figure: "Club", width: 40, height: 60, margin: 4, fill: 'red' },然后通过new go.Binding("figure", "fig")方法将模板里面的属性映射到数据实例中,比如这里模板里面的figure属性定义的是Club,如果在我们的数据里面定义fig属性,那么它就会覆盖模板里面的figure的默认值。同样,fill和fill2也是通过同样的原理去区别模板中的样式和实例中的实际样式的!
注:更多figure属性的取值详见这里
效果如下

由此可见我们数据里面的属性会覆盖模板的原始属性,如果是新增的节点,由于没有自定义数据属性,所以呈现到界面上面的时候就是模板里面的原生样式!
(5)节点连线
有了上面的基础,我们可以在画布上面画出我们想要的图形效果了,可是还没有连线。我们知道连线是建立在节点模型的上面的,于是乎我们的Model又分为了以下三种类型:
Model:最基本的(不带连线,如上面的例子)
GraphLinksModel :高级点的动态连线图
TreeModel:树形图的模型(从例子看好像用的不多)
GraphLinksModel中为model.nodeDataArray提供model.linkDataArray为node节点连线保存数据模型信息,其实也是的一个JSON数组对象,每个线条都有两个属性 “to” 和 “from” 即Node节点的“key”值,两个属性代表两个key表示两个节点间的连线。
我们上面已经写过最基本的Model的例子了,我们再来个带连线的Model的示例
var myModel = objGo(go.GraphLinksModel);
  myModel.nodeDataArray =
   [
    { key: "aaa" ,name: "工厂" },
    { key: "bbb" ,name: "车间"},
    { key: "ccc" ,name: "车间" }
   ];
  myModel.linkDataArray =
   [
    { from: "aaa", to: "bbb" },
    { from: "bbb", to: "ccc" }
   ];
  myDiagram.model = myModel;
效果如下

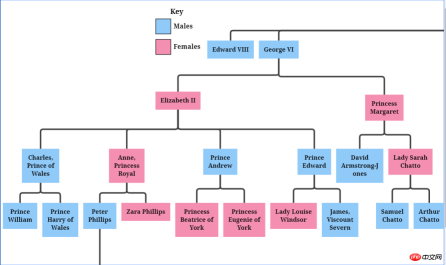
学习了Model、GraphLinksModel,还剩下一种TreeModel树节点的模型,这个博主不打算做详细介绍,有兴趣可以直接查看官网。
三、综合效果
关于综合效果,博主不打算将gojs的api逐个翻个遍了,这样太耗时间,伤不起,只是将官方示例中的部分源码截取出来供大家参考。有需要的再细究!
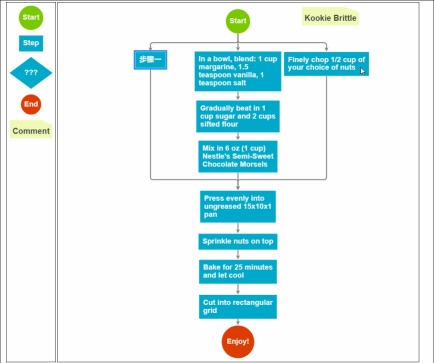
1、自定义流程的使用
<!DOCTYPE html>
<html>
<head>
<meta name="viewport" content="width=device-width, initial-scale=1">
<title>Draggable Link</title>
<meta name="description" content="Drag a link to reconnect it. Nodes have custom Adornments for selection, resizing, and reshaping." />
<!-- Copyright 1998-2017 by Northwoods Software Corporation. -->
<meta charset="UTF-8">
<script src="../../gojs/go-debug.js"></script>
<script id="code">
function init() {
if (window.goSamples) goSamples(); // init for these samples -- you don't need to call this
var objGo = go.GraphObject.make; // for conciseness in defining templates
myDiagram =
objGo(go.Diagram, "myDiagramp", // must name or refer to the p HTML element
{
grid: objGo(go.Panel, "Grid",
objGo(go.Shape, "LineH", { stroke: "lightgray", strokeWidth: 0.5 }),
objGo(go.Shape, "LineH", { stroke: "gray", strokeWidth: 0.5, interval: 10 }),
objGo(go.Shape, "LineV", { stroke: "lightgray", strokeWidth: 0.5 }),
objGo(go.Shape, "LineV", { stroke: "gray", strokeWidth: 0.5, interval: 10 })
),
allowDrop: true, // must be true to accept drops from the Palette
"draggingTool.dragsLink": true,
"draggingTool.isGridSnapEnabled": true,
"linkingTool.isUnconnectedLinkValid": true,
"linkingTool.portGravity": 20,
"relinkingTool.isUnconnectedLinkValid": true,
"relinkingTool.portGravity": 20,
"relinkingTool.fromHandleArchetype":
objGo(go.Shape, "Diamond", { segmentIndex: 0, cursor: "pointer", desiredSize: new go.Size(8, 8), fill: "tomato", stroke: "darkred" }),
"relinkingTool.toHandleArchetype":
objGo(go.Shape, "Diamond", { segmentIndex: -1, cursor: "pointer", desiredSize: new go.Size(8, 8), fill: "darkred", stroke: "tomato" }),
"linkReshapingTool.handleArchetype":
objGo(go.Shape, "Diamond", { desiredSize: new go.Size(7, 7), fill: "lightblue", stroke: "deepskyblue" }),
rotatingTool: objGo(TopRotatingTool), // defined below
"rotatingTool.snapAngleMultiple": 15,
"rotatingTool.snapAngleEpsilon": 15,
"undoManager.isEnabled": true
});
// when the document is modified, add a "*" to the title and enable the "Save" button
myDiagram.addDiagramListener("Modified", function(e) {
var button = document.getElementById("SaveButton");
if (button) button.disabled = !myDiagram.isModified;
var idx = document.title.indexOf("*");
if (myDiagram.isModified) {
if (idx < 0) document.title += "*";
} else {
if (idx >= 0) document.title = document.title.substr(0, idx);
}
});
// Define a function for creating a "port" that is normally transparent.
// The "name" is used as the GraphObject.portId, the "spot" is used to control how links connect
// and where the port is positioned on the node, and the boolean "output" and "input" arguments
// control whether the user can draw links from or to the port.
function makePort(name, spot, output, input) {
// the port is basically just a small transparent square
return objGo(go.Shape, "Circle",
{
fill: null, // not seen, by default; set to a translucent gray by showSmallPorts, defined below
stroke: null,
desiredSize: new go.Size(7, 7),
alignment: spot, // align the port on the main Shape
alignmentFocus: spot, // just inside the Shape
portId: name, // declare this object to be a "port"
fromSpot: spot, toSpot: spot, // declare where links may connect at this port
fromLinkable: output, toLinkable: input, // declare whether the user may draw links to/from here
cursor: "pointer" // show a different cursor to indicate potential link point
});
}
var nodeSelectionAdornmentTemplate =
objGo(go.Adornment, "Auto",
objGo(go.Shape, { fill: null, stroke: "deepskyblue", strokeWidth: 1.5, strokeDashArray: [4, 2] }),
objGo(go.Placeholder)
);
var nodeResizeAdornmentTemplate =
objGo(go.Adornment, "Spot",
{ locationSpot: go.Spot.Right },
objGo(go.Placeholder),
objGo(go.Shape, { alignment: go.Spot.TopLeft, cursor: "nw-resize", desiredSize: new go.Size(6, 6), fill: "lightblue", stroke: "deepskyblue" }),
objGo(go.Shape, { alignment: go.Spot.Top, cursor: "n-resize", desiredSize: new go.Size(6, 6), fill: "lightblue", stroke: "deepskyblue" }),
objGo(go.Shape, { alignment: go.Spot.TopRight, cursor: "ne-resize", desiredSize: new go.Size(6, 6), fill: "lightblue", stroke: "deepskyblue" }),
objGo(go.Shape, { alignment: go.Spot.Left, cursor: "w-resize", desiredSize: new go.Size(6, 6), fill: "lightblue", stroke: "deepskyblue" }),
objGo(go.Shape, { alignment: go.Spot.Right, cursor: "e-resize", desiredSize: new go.Size(6, 6), fill: "lightblue", stroke: "deepskyblue" }),
objGo(go.Shape, { alignment: go.Spot.BottomLeft, cursor: "se-resize", desiredSize: new go.Size(6, 6), fill: "lightblue", stroke: "deepskyblue" }),
objGo(go.Shape, { alignment: go.Spot.Bottom, cursor: "s-resize", desiredSize: new go.Size(6, 6), fill: "lightblue", stroke: "deepskyblue" }),
objGo(go.Shape, { alignment: go.Spot.BottomRight, cursor: "sw-resize", desiredSize: new go.Size(6, 6), fill: "lightblue", stroke: "deepskyblue" })
);
var nodeRotateAdornmentTemplate =
objGo(go.Adornment,
{ locationSpot: go.Spot.Center, locationObjectName: "CIRCLE" },
objGo(go.Shape, "Circle", { name: "CIRCLE", cursor: "pointer", desiredSize: new go.Size(7, 7), fill: "lightblue", stroke: "deepskyblue" }),
objGo(go.Shape, { geometryString: "M3.5 7 L3.5 30", isGeometryPositioned: true, stroke: "deepskyblue", strokeWidth: 1.5, strokeDashArray: [4, 2] })
);
myDiagram.nodeTemplate =
objGo(go.Node, "Spot",
{ locationSpot: go.Spot.Center },
new go.Binding("location", "loc", go.Point.parse).makeTwoWay(go.Point.stringify),
{ selectable: true, selectionAdornmentTemplate: nodeSelectionAdornmentTemplate },
{ resizable: true, resizeObjectName: "PANEL", resizeAdornmentTemplate: nodeResizeAdornmentTemplate },
{ rotatable: true, rotateAdornmentTemplate: nodeRotateAdornmentTemplate },
new go.Binding("angle").makeTwoWay(),
// the main object is a Panel that surrounds a TextBlock with a Shape
objGo(go.Panel, "Auto",
{ name: "PANEL" },
new go.Binding("desiredSize", "size", go.Size.parse).makeTwoWay(go.Size.stringify),
objGo(go.Shape, "Rectangle", // default figure
{
portId: "", // the default port: if no spot on link data, use closest side
fromLinkable: true, toLinkable: true, cursor: "pointer",
fill: "white", // default color
strokeWidth: 2
},
new go.Binding("figure"),
new go.Binding("fill")),
objGo(go.TextBlock,
{
font: "bold 11pt Helvetica, Arial, sans-serif",
margin: 8,
maxSize: new go.Size(160, NaN),
wrap: go.TextBlock.WrapFit,
editable: true
},
new go.Binding("text").makeTwoWay())
),
// four small named ports, one on each side:
makePort("T", go.Spot.Top, false, true),
makePort("L", go.Spot.Left, true, true),
makePort("R", go.Spot.Right, true, true),
makePort("B", go.Spot.Bottom, true, false),
{ // handle mouse enter/leave events to show/hide the ports
mouseEnter: function(e, node) { showSmallPorts(node, true); },
mouseLeave: function(e, node) { showSmallPorts(node, false); }
}
);
function showSmallPorts(node, show) {
node.ports.each(function(port) {
if (port.portId !== "") { // don't change the default port, which is the big shape
port.fill = show ? "rgba(0,0,0,.3)" : null;
}
});
}
var linkSelectionAdornmentTemplate =
objGo(go.Adornment, "Link",
objGo(go.Shape,
// isPanelMain declares that this Shape shares the Link.geometry
{ isPanelMain: true, fill: null, stroke: "deepskyblue", strokeWidth: 0 }) // use selection object's strokeWidth
);
myDiagram.linkTemplate =
objGo(go.Link, // the whole link panel
{ selectable: true, selectionAdornmentTemplate: linkSelectionAdornmentTemplate },
{ relinkableFrom: true, relinkableTo: true, reshapable: true },
{
routing: go.Link.AvoidsNodes,
curve: go.Link.JumpOver,
corner: 5,
toShortLength: 4
},
new go.Binding("points").makeTwoWay(),
objGo(go.Shape, // the link path shape
{ isPanelMain: true, strokeWidth: 2 }),
objGo(go.Shape, // the arrowhead
{ toArrow: "Standard", stroke: null }),
objGo(go.Panel, "Auto",
new go.Binding("visible", "isSelected").ofObject(),
objGo(go.Shape, "RoundedRectangle", // the link shape
{ fill: "#F8F8F8", stroke: null }),
objGo(go.TextBlock,
{
textAlign: "center",
font: "10pt helvetica, arial, sans-serif",
stroke: "#919191",
margin: 2,
minSize: new go.Size(10, NaN),
editable: true
},
new go.Binding("text").makeTwoWay())
)
);
load(); // load an initial diagram from some JSON text
// initialize the Palette that is on the left side of the page
myPalette =
objGo(go.Palette, "myPalettep", // must name or refer to the p HTML element
{
maxSelectionCount: 1,
nodeTemplateMap: myDiagram.nodeTemplateMap, // share the templates used by myDiagram
linkTemplate: // simplify the link template, just in this Palette
objGo(go.Link,
{ // because the GridLayout.alignment is Location and the nodes have locationSpot == Spot.Center,
// to line up the Link in the same manner we have to pretend the Link has the same location spot
locationSpot: go.Spot.Center,
selectionAdornmentTemplate:
objGo(go.Adornment, "Link",
{ locationSpot: go.Spot.Center },
objGo(go.Shape,
{ isPanelMain: true, fill: null, stroke: "deepskyblue", strokeWidth: 0 }),
objGo(go.Shape, // the arrowhead
{ toArrow: "Standard", stroke: null })
)
},
{
routing: go.Link.AvoidsNodes,
curve: go.Link.JumpOver,
corner: 5,
toShortLength: 4
},
new go.Binding("points"),
objGo(go.Shape, // the link path shape
{ isPanelMain: true, strokeWidth: 2 }),
objGo(go.Shape, // the arrowhead
{ toArrow: "Standard", stroke: null })
),
model: new go.GraphLinksModel([ // specify the contents of the Palette
{ text: "Start", figure: "Circle", fill: "#00AD5F" },
{ text: "Step" },
{ text: "DB", figure: "Database", fill: "lightgray" },
{ text: "???", figure: "Diamond", fill: "lightskyblue" },
{ text: "End", figure: "Circle", fill: "#CE0620" },
{ text: "Comment", figure: "RoundedRectangle", fill: "lightyellow" }
], [
// the Palette also has a disconnected Link, which the user can drag-and-drop
{ points: new go.List(go.Point).addAll([new go.Point(0, 0), new go.Point(30, 0), new go.Point(30, 40), new go.Point(60, 40)]) }
])
});
}
function TopRotatingTool() {
go.RotatingTool.call(this);
}
go.Diagram.inherit(TopRotatingTool, go.RotatingTool);
/** @override */
TopRotatingTool.prototype.updateAdornments = function(part) {
go.RotatingTool.prototype.updateAdornments.call(this, part);
var adornment = part.findAdornment("Rotating");
if (adornment !== null) {
adornment.location = part.rotateObject.getDocumentPoint(new go.Spot(0.5, 0, 0, -30)); // above middle top
}
};
/** @override */
TopRotatingTool.prototype.rotate = function(newangle) {
go.RotatingTool.prototype.rotate.call(this, newangle + 90);
};
// end of TopRotatingTool class
// Show the diagram's model in JSON format that the user may edit
function save() {
saveDiagramProperties(); // do this first, before writing to JSON
document.getElementById("mySavedModel").value = myDiagram.model.toJson();
myDiagram.isModified = false;
}
function load() {
myDiagram.model = go.Model.fromJson(document.getElementById("mySavedModel").value);
loadDiagramProperties(); // do this after the Model.modelData has been brought into memory
}
function saveDiagramProperties() {
myDiagram.model.modelData.position = go.Point.stringify(myDiagram.position);
}
function loadDiagramProperties(e) {
// set Diagram.initialPosition, not Diagram.position, to handle initialization side-effects
var pos = myDiagram.model.modelData.position;
if (pos) myDiagram.initialPosition = go.Point.parse(pos);
}
</script>
</head>
<body onload="init()">
<p id="sample">
<p style="width:100%; white-space:nowrap;">
<span style="display: inline-block; vertical-align: top; width:105px">
<p id="myPalettep" style="border: solid 1px black; height: 620px"></p>
</span>
<span style="display: inline-block; vertical-align: top; width:80%">
<p id="myDiagramp" style="border: solid 1px black; height: 620px"></p>
</span>
</p>
<p>
This sample demonstrates the ability for the user to drag around a Link as if it were a Node.
When either end of the link passes over a valid port, the port is highlighted.
</p>
<p>
The link-dragging functionality is enabled by setting some or all of the following properties:
<a>DraggingTool.dragsLink</a>, <a>LinkingTool.isUnconnectedLinkValid</a>, and
<a>RelinkingTool.isUnconnectedLinkValid</a>.
</p>
<p>
Note that a Link is present in the <a>Palette</a> so that it too can be dragged out and onto
the main Diagram. Because links are not automatically routed when either end is not connected
with a Node, the route is provided explicitly when that Palette item is defined.
</p>
<p>
This also demonstrates several custom Adornments:
<a>Part.selectionAdornmentTemplate</a>, <a>Part.resizeAdornmentTemplate</a>, and
<a>Part.rotateAdornmentTemplate</a>.
</p>
<p>
Finally this sample demonstrates saving and restoring the <a>Diagram.position</a> as a property
on the <a>Model.modelData</a> object that is automatically saved and restored when calling <a>Model.toJson</a>
and <a>Model.fromJson</a>.
</p>
<p>
<p>
<button id="SaveButton" onclick="save()">Save</button>
<button onclick="load()">Load</button>
Diagram Model saved in JSON format:
</p>
<textarea id="mySavedModel" style="width:100%;height:300px">
{ "class": "go.GraphLinksModel",
"linkFromPortIdProperty": "fromPort",
"linkToPortIdProperty": "toPort",
"nodeDataArray": [
],
"linkDataArray": [
]}
</textarea>
</p>
</p>
</body>
</html>效果如下:

建议各位copy代码,在本地看到效果,然后再根据实际需求去研究它的api,这样才不会太盲目而花费太多时间。
2、工业流程图
<!DOCTYPE html>
<html>
<head>
<meta name="viewport" content="width=device-width, initial-scale=1">
<title>Process Flow</title>
<meta name="description" content="A simple process flow or SCADA diagram editor, simulating equipment monitoring and control." />
<!-- Copyright 1998-2017 by Northwoods Software Corporation. -->
<meta charset="UTF-8">
<script src="../../gojs/go-debug.js"></script>
<script id="code">
function init() {
if (window.goSamples) goSamples(); // init for these samples -- you don't need to call this
var $ = go.GraphObject.make; // for more concise visual tree definitions
myDiagram =
$(go.Diagram, "myDiagramp",
{
"grid.visible": true,
"grid.gridCellSize": new go.Size(30, 20),
"draggingTool.isGridSnapEnabled": true,
"resizingTool.isGridSnapEnabled": true,
"rotatingTool.snapAngleMultiple": 90,
"rotatingTool.snapAngleEpsilon": 45,
"undoManager.isEnabled": true
});
// when the document is modified, add a "*" to the title and enable the "Save" button
myDiagram.addDiagramListener("Modified", function(e) {
var button = document.getElementById("SaveButton");
if (button) button.disabled = !myDiagram.isModified;
var idx = document.title.indexOf("*");
if (myDiagram.isModified) {
if (idx < 0) document.title += "*";
} else {
if (idx >= 0) document.title = document.title.substr(0, idx);
}
});
myDiagram.nodeTemplateMap.add("Process",
$(go.Node, "Auto",
{ locationSpot: new go.Spot(0.5, 0.5), locationObjectName: "SHAPE",
resizable: true, resizeObjectName: "SHAPE" },
new go.Binding("location", "pos", go.Point.parse).makeTwoWay(go.Point.stringify),
$(go.Shape, "Cylinder1",
{ name: "SHAPE",
strokeWidth: 2,
fill: $(go.Brush, "Linear",
{ start: go.Spot.Left, end: go.Spot.Right,
0: "gray", 0.5: "white", 1: "gray" }),
minSize: new go.Size(50, 50),
portId: "", fromSpot: go.Spot.AllSides, toSpot: go.Spot.AllSides
},
new go.Binding("desiredSize", "size", go.Size.parse).makeTwoWay(go.Size.stringify)),
$(go.TextBlock,
{ alignment: go.Spot.Center, textAlign: "center", margin: 5,
editable: true },
new go.Binding("text").makeTwoWay())
));
myDiagram.nodeTemplateMap.add("Valve",
$(go.Node, "Vertical",
{ locationSpot: new go.Spot(0.5, 1, 0, -21), locationObjectName: "SHAPE",
selectionObjectName: "SHAPE", rotatable: true },
new go.Binding("angle").makeTwoWay(),
new go.Binding("location", "pos", go.Point.parse).makeTwoWay(go.Point.stringify),
$(go.TextBlock,
{ alignment: go.Spot.Center, textAlign: "center", margin: 5, editable: true },
new go.Binding("text").makeTwoWay(),
// keep the text upright, even when the whole node has been rotated upside down
new go.Binding("angle", "angle", function(a) { return a === 180 ? 180 : 0; }).ofObject()),
$(go.Shape,
{ name: "SHAPE",
geometryString: "F1 M0 0 L40 20 40 0 0 20z M20 10 L20 30 M12 30 L28 30",
strokeWidth: 2,
fill: $(go.Brush, "Linear", { 0: "gray", 0.35: "white", 0.7: "gray" }),
portId: "", fromSpot: new go.Spot(1, 0.35), toSpot: new go.Spot(0, 0.35) })
));
myDiagram.linkTemplate =
$(go.Link,
{ routing: go.Link.AvoidsNodes, curve: go.Link.JumpGap, corner: 10, reshapable: true, toShortLength: 7 },
new go.Binding("points").makeTwoWay(),
// mark each Shape to get the link geometry with isPanelMain: true
$(go.Shape, { isPanelMain: true, stroke: "black", strokeWidth: 5 }),
$(go.Shape, { isPanelMain: true, stroke: "gray", strokeWidth: 3 }),
$(go.Shape, { isPanelMain: true, stroke: "white", strokeWidth: 1, name: "PIPE", strokeDashArray: [10, 10] }),
$(go.Shape, { toArrow: "Triangle", fill: "black", stroke: null })
);
load();
loop(); // animate some flow through the pipes
}
function loop() {
var diagram = myDiagram;
setTimeout(function() {
var oldskips = diagram.skipsUndoManager;
diagram.skipsUndoManager = true;
diagram.links.each(function(link) {
var shape = link.findObject("PIPE");
var off = shape.strokeDashOffset - 2;
shape.strokeDashOffset = (off <= 0) ? 20 : off;
});
diagram.skipsUndoManager = oldskips;
loop();
}, 100);
}
function save() {
document.getElementById("mySavedModel").value = myDiagram.model.toJson();
myDiagram.isModified = false;
}
function load() {
myDiagram.model = go.Model.fromJson(document.getElementById("mySavedModel").value);
}
</script>
</head>
<body onload="init()">
<p id="sample">
<p id="myDiagramp" style="border: solid 1px black; width:100%; height:500px"></p>
<p>
A <em>process flow diagram</em> is commonly used in chemical and process engineering to indicate the general flow of plant processes and equipment.
A simple SCADA diagram, with animation of the flow along the pipes, is implemented here.
</p>
<p>
The diagram displays the background grid layer by setting <b>grid.visible</b> to true,
and also allows snapping to the grid using <a>DraggingTool.isGridSnapEnabled</a>,
<a>ResizingTool.isGridSnapEnabled</a>, and <a>RotatingTool.snapAngleMultiple</a> alongside <a>RotatingTool.snapAngleEpsilon</a>.
</p>
<p>
The diagram also uses the <b>loop</b> function to animate the links by adjusting the <a>Shape.strokeDashOffset</a> every 100 ms.
</p>
<p>
<p>
<button id="SaveButton" onclick="save()">Save</button>
<button onclick="load()">Load</button>
Diagram Model saved in JSON format:
</p>
<textarea id="mySavedModel" style="width:100%;height:300px">
{ "class": "go.GraphLinksModel",
"nodeDataArray": [
{"key":"P1", "category":"Process", "pos":"150 120", "text":"Process"},
{"key":"P2", "category":"Process", "pos":"330 320", "text":"Tank"},
{"key":"V1", "category":"Valve", "pos":"270 120", "text":"V1"},
{"key":"P3", "category":"Process", "pos":"150 420", "text":"Pump"},
{"key":"V2", "category":"Valve", "pos":"150 280", "text":"VM", "angle":270},
{"key":"V3", "category":"Valve", "pos":"270 420", "text":"V2", "angle":180},
{"key":"P4", "category":"Process", "pos":"450 140", "text":"Reserve Tank"},
{"key":"V4", "category":"Valve", "pos":"390 60", "text":"VA"},
{"key":"V5", "category":"Valve", "pos":"450 260", "text":"VB", "angle":90}
],
"linkDataArray": [
{"from":"P1", "to":"V1"},
{"from":"P3", "to":"V2"},
{"from":"V2", "to":"P1"},
{"from":"P2", "to":"V3"},
{"from":"V3", "to":"P3"},
{"from":"V1", "to":"V4"},
{"from":"V4", "to":"P4"},
{"from":"V1", "to":"P2"},
{"from":"P4", "to":"V5"},
{"from":"V5", "to":"P2"}
]}
</textarea>
</p>
</p>
</body>
</html>工业流程图

四、总结
本文根据js的一些基础用法做了简单介绍,今天就先到这里,以后有问题了再来跟大家分享。如果你的项目里面也有这种业务需求,可以用起来试试!需要说明一点,如果您的公司不缺钱,建议使用正版授权的组件,毕竟尊重作者的劳动成果很重要!
相关推荐:
Javascript-EXTJS component development complete code
Solve the problems encountered during the implementation of JS component bootstrap table paging
Implement drag slider verification function based on JS component
The above is the detailed content of JS front-end graphical plug-in tool Gojs component. For more information, please follow other related articles on the PHP Chinese website!

 Understanding the JavaScript Engine: Implementation DetailsApr 17, 2025 am 12:05 AM
Understanding how JavaScript engine works internally is important to developers because it helps write more efficient code and understand performance bottlenecks and optimization strategies. 1) The engine's workflow includes three stages: parsing, compiling and execution; 2) During the execution process, the engine will perform dynamic optimization, such as inline cache and hidden classes; 3) Best practices include avoiding global variables, optimizing loops, using const and lets, and avoiding excessive use of closures.
 Python vs. JavaScript: The Learning Curve and Ease of UseApr 16, 2025 am 12:12 AM
Python is more suitable for beginners, with a smooth learning curve and concise syntax; JavaScript is suitable for front-end development, with a steep learning curve and flexible syntax. 1. Python syntax is intuitive and suitable for data science and back-end development. 2. JavaScript is flexible and widely used in front-end and server-side programming.
 Python vs. JavaScript: Community, Libraries, and ResourcesApr 15, 2025 am 12:16 AM
Python and JavaScript have their own advantages and disadvantages in terms of community, libraries and resources. 1) The Python community is friendly and suitable for beginners, but the front-end development resources are not as rich as JavaScript. 2) Python is powerful in data science and machine learning libraries, while JavaScript is better in front-end development libraries and frameworks. 3) Both have rich learning resources, but Python is suitable for starting with official documents, while JavaScript is better with MDNWebDocs. The choice should be based on project needs and personal interests.
 From C/C to JavaScript: How It All WorksApr 14, 2025 am 12:05 AM
The shift from C/C to JavaScript requires adapting to dynamic typing, garbage collection and asynchronous programming. 1) C/C is a statically typed language that requires manual memory management, while JavaScript is dynamically typed and garbage collection is automatically processed. 2) C/C needs to be compiled into machine code, while JavaScript is an interpreted language. 3) JavaScript introduces concepts such as closures, prototype chains and Promise, which enhances flexibility and asynchronous programming capabilities.
 JavaScript Engines: Comparing ImplementationsApr 13, 2025 am 12:05 AM
Different JavaScript engines have different effects when parsing and executing JavaScript code, because the implementation principles and optimization strategies of each engine differ. 1. Lexical analysis: convert source code into lexical unit. 2. Grammar analysis: Generate an abstract syntax tree. 3. Optimization and compilation: Generate machine code through the JIT compiler. 4. Execute: Run the machine code. V8 engine optimizes through instant compilation and hidden class, SpiderMonkey uses a type inference system, resulting in different performance performance on the same code.
 Beyond the Browser: JavaScript in the Real WorldApr 12, 2025 am 12:06 AM
JavaScript's applications in the real world include server-side programming, mobile application development and Internet of Things control: 1. Server-side programming is realized through Node.js, suitable for high concurrent request processing. 2. Mobile application development is carried out through ReactNative and supports cross-platform deployment. 3. Used for IoT device control through Johnny-Five library, suitable for hardware interaction.
 Building a Multi-Tenant SaaS Application with Next.js (Backend Integration)Apr 11, 2025 am 08:23 AM
I built a functional multi-tenant SaaS application (an EdTech app) with your everyday tech tool and you can do the same. First, what’s a multi-tenant SaaS application? Multi-tenant SaaS applications let you serve multiple customers from a sing
 How to Build a Multi-Tenant SaaS Application with Next.js (Frontend Integration)Apr 11, 2025 am 08:22 AM
This article demonstrates frontend integration with a backend secured by Permit, building a functional EdTech SaaS application using Next.js. The frontend fetches user permissions to control UI visibility and ensures API requests adhere to role-base


Hot AI Tools

Undresser.AI Undress
AI-powered app for creating realistic nude photos

AI Clothes Remover
Online AI tool for removing clothes from photos.

Undress AI Tool
Undress images for free

Clothoff.io
AI clothes remover

AI Hentai Generator
Generate AI Hentai for free.

Hot Article
Hot Tools

SecLists
SecLists is the ultimate security tester's companion. It is a collection of various types of lists that are frequently used during security assessments, all in one place. SecLists helps make security testing more efficient and productive by conveniently providing all the lists a security tester might need. List types include usernames, passwords, URLs, fuzzing payloads, sensitive data patterns, web shells, and more. The tester can simply pull this repository onto a new test machine and he will have access to every type of list he needs.

PhpStorm Mac version
The latest (2018.2.1) professional PHP integrated development tool

DVWA
Damn Vulnerable Web App (DVWA) is a PHP/MySQL web application that is very vulnerable. Its main goals are to be an aid for security professionals to test their skills and tools in a legal environment, to help web developers better understand the process of securing web applications, and to help teachers/students teach/learn in a classroom environment Web application security. The goal of DVWA is to practice some of the most common web vulnerabilities through a simple and straightforward interface, with varying degrees of difficulty. Please note that this software

Dreamweaver Mac version
Visual web development tools

Dreamweaver CS6
Visual web development tools

