
Home >Backend Development >PHP Tutorial >Graphical code tutorial on the installation and use of xhprof performance analysis tool under php7
Graphical code tutorial on the installation and use of xhprof performance analysis tool under php7

- 黄舟Original
- 2017-08-10 11:15:573189browse
Install xhprof
cd xhprof/extension/
phpize
./configure
makemake install
Then add
extension=xhprof.so
execution
php -m | grep xhprof
to /etc/php.ini according to the situation and you can see Output, indicating that the php extension is installed successfully, and then restart Apache or php-fpm
Run
You can directly run the example in the example directory in the file cloned from github
The output is as follows
Array
(    [main()] => Array        (            [ct] => 1            [wt] => 9        ))
---------------Assuming you have set up the http based UI for
XHProf at some address, you can view run at
http://<xhprof-ui-address>/index.php?run=592567308784c&source=xhprof_foo
---------------
Then copy the ?run=592567308784c&source=xhprof_foo
Visit
xhprof_html/index.php?run=592567308784c&source=xhprof_foo
You can see the output
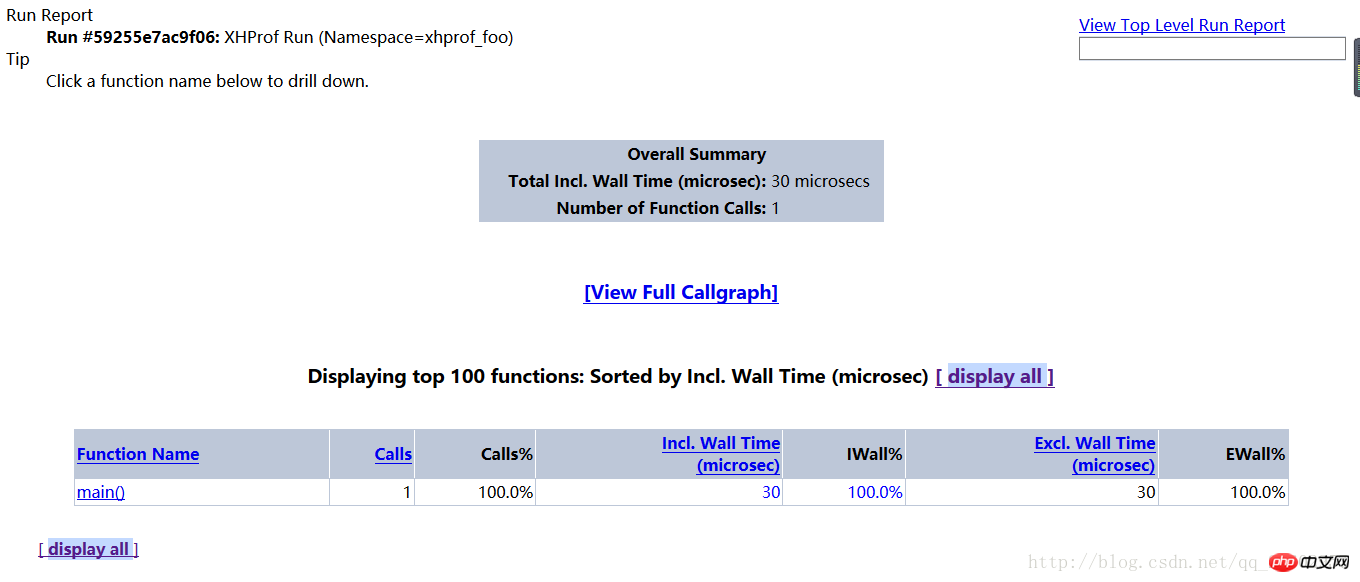
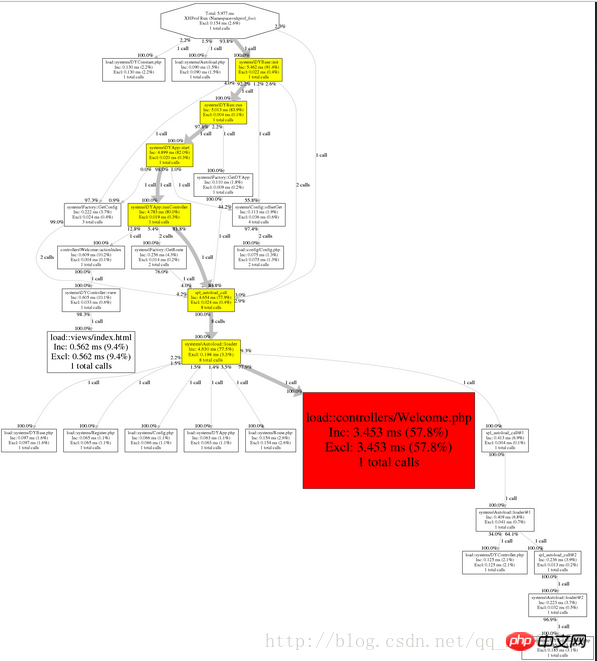
Click View Full Callgraph in the middle to see the performance analysis picture
Error reporting
failed to execute cmd:" dot -Tpng". stderr:sh: dot:command not found。
//解决方案yum install graphviz
Adapt to changes
For example, if you want to test your own project, such as a framework Performance analysis.
Copy the two files under xhprof_lib/utils/
xhprof_lib.php and xhprof_runs.php to the same directory as the entry file, and then add
// start profiling
xhprof_enable();
## at the beginning of the entry file #Add
// stop profiler
$xhprof_data = xhprof_disable();

// display raw xhprof data for the profiler run
print_r($xhprof_data);


include_once "xhprof_lib.php";
include_once "xhprof_runs.php";

// save raw data for this profiler run using default
// implementation of iXHProfRuns.
$xhprof_runs = new XHProfRuns_Default();

// save the run under a namespace "xhprof_foo"
$run_id = $xhprof_runs->save_run($xhprof_data, "xhprof_foo");

echo "---------------\n".
     "Assuming you have set up the http based UI for \n".
     "XHProf at some address, you can view run at \n".
     "http://<xhprof-ui-address>/index.php?run=$run_id&source=xhprof_foo\n".
     "---------------\n";
to the end position to get the url shown above, and then visit http://***/xhprof_html/index.php?run=*****&source=xhprof_fooagain to get the page shown below
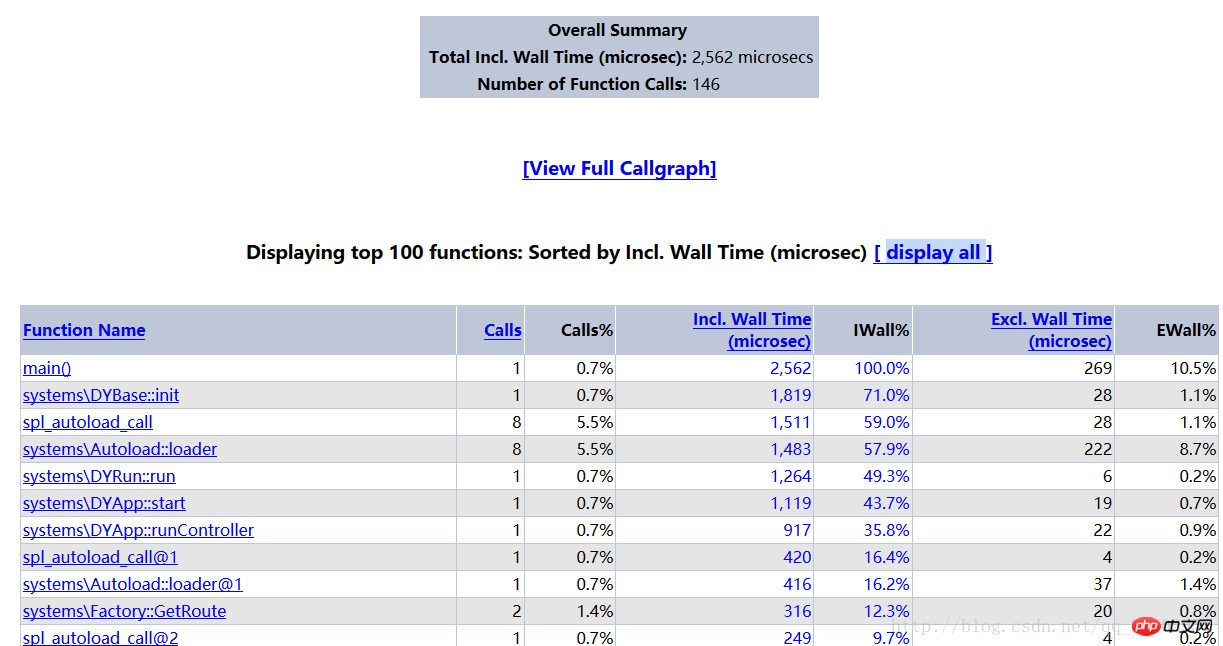
    Function Name:方法名称。

    Calls:方法被调用的次数。

    Calls%:方法调用次数在同级方法总数调用次数中所占的百分比。

    Incl.Wall Time(microsec):方法执行花费的时间,包括子方法的执行时间。(单位:微秒)

    IWall%:方法执行花费的时间百分比。

    Excl. Wall Time(microsec):方法本身执行花费的时间,不包括子方法的执行时间。(单位:微秒)

    EWall%:方法本身执行花费的时间百分比。

    Incl. CPU(microsecs):方法执行花费的CPU时间,包括子方法的执行时间。(单位:微秒)

    ICpu%:方法执行花费的CPU时间百分比。

    Excl. CPU(microsec):方法本身执行花费的CPU时间,不包括子方法的执行时间。(单位:微秒)

    ECPU%:方法本身执行花费的CPU时间百分比。

    Incl.MemUse(bytes):方法执行占用的内存,包括子方法执行占用的内存。(单位:字节)

    IMemUse%:方法执行占用的内存百分比。

    Excl.MemUse(bytes):方法本身执行占用的内存,不包括子方法执行占用的内存。(单位:字节)

    EMemUse%:方法本身执行占用的内存百分比。

    Incl.PeakMemUse(bytes):Incl.MemUse峰值。(单位:字节)

    IPeakMemUse%:Incl.MemUse峰值百分比。

    Excl.PeakMemUse(bytes):Excl.MemUse峰值。单位:(字节)

    EPeakMemUse%:Excl.MemUse峰值百分比。
The above is the detailed content of Graphical code tutorial on the installation and use of xhprof performance analysis tool under php7. For more information, please follow other related articles on the PHP Chinese website!