Home >Backend Development >Python Tutorial >Detailed explanation of examples of drawing graphics with python
Detailed explanation of examples of drawing graphics with python
- PHP中文网Original
- 2017-06-20 15:55:325531browse
1. Environment
System: windows10
python version: python3.6.1
Libraries used: matplotlib, numpy
2. Several ways for the numpy library to generate random numbers
import numpy as npnumpy.random
rand(d0, d1 , ..., dn) In [2]: x=np.random.rand(2,5)
In [3]: x
Out[3 ]:
array([[ 0.84286554, 0.50007593, 0.66500549, 0.97387807, 0.03993009],
[ 0.46391661, 0.50717355, 0.21527461 , 0.92692517, 0.2567891 ]])randn(d0, d1, ..., dn) query result is standard normal distribution
In [4]: x=np.random.randn(2, 5)
In [5]: x
Out[5]:
array([[-0.77195196, 0.26651203, -0.35045793, -0.0210377, 0.89749635],
[-0.20229338, 1.44 852833 , -0.10858996, -1.65034606, -0.39793635]])randint(low,high,size) Generate between low and high (Half-open interval [low, high)), size data
In [6]: x=np.random.randint(1,8,4)
In [7]: x
Out[7]: array([4, 4, 2, 7])##random_integers(low,high,size) Generate size data between low and high (closed interval [low, high))In [10]: x=np.random.random_integers(2,10,5)In [11]: x Out[11]: array([7, 4, 5, 4, 2])
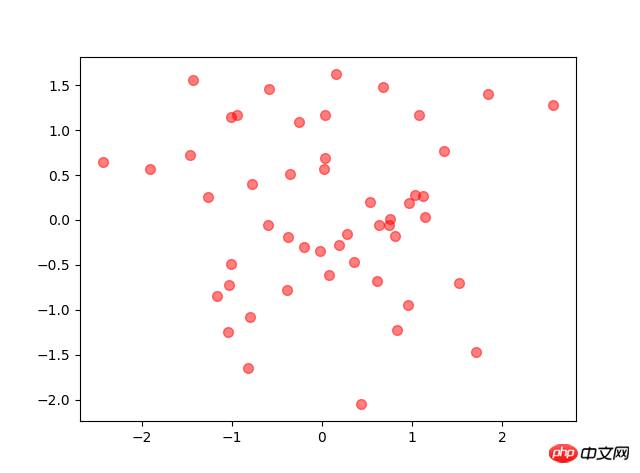
3.Scatter chart
x x轴
y y轴
s   圆点面积
c   颜色
marker  圆点形状
alpha   圆点透明度                #其他图也类似这种配置
N=50# height=np.random.randint(150,180,20)# weight=np.random.randint(80,150,20)
x=np.random.randn(N)
y=np.random.randn(N)
plt.scatter(x,y,s=50,c='r',marker='o',alpha=0.5)
plt.show()
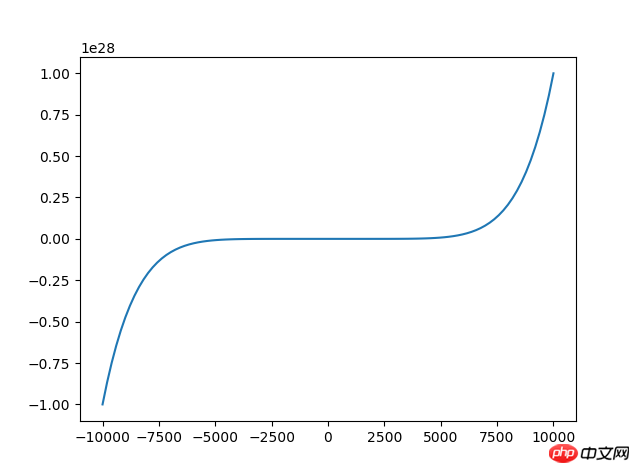
##4. Line chart
<code class="language-python hljs"># 来源:百度网盘搜索 <br/>x=np.linspace(<span class="hljs-number">-10000,<span class="hljs-number">10000,<span class="hljs-number">100) <span class="hljs-comment">#将-10到10等区间分成100份
y=x**<span class="hljs-number">2+x**<span class="hljs-number">3+x**<span class="hljs-number">7
plt.plot(x,y)
plt.show()</span></span></span></span></span></span></span></code>
Line chart uses plot function
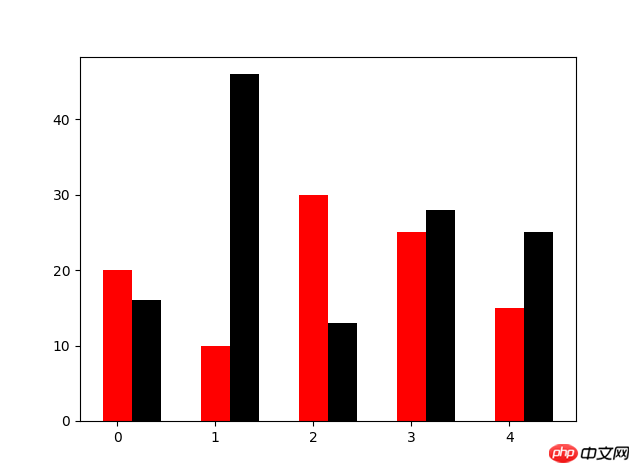
5. Bar chart
N=5
y=[20,10,30,25,15]
y1=np.random.randint(10,50,5)
x=np.random.randint(10,1000,N)
index=np.arange(N)
plt.bar(left=index,height=y,color='red',width=0.3)
plt.bar(left=index+0.3,height=y1,color='black',width=0.3)
plt.show()
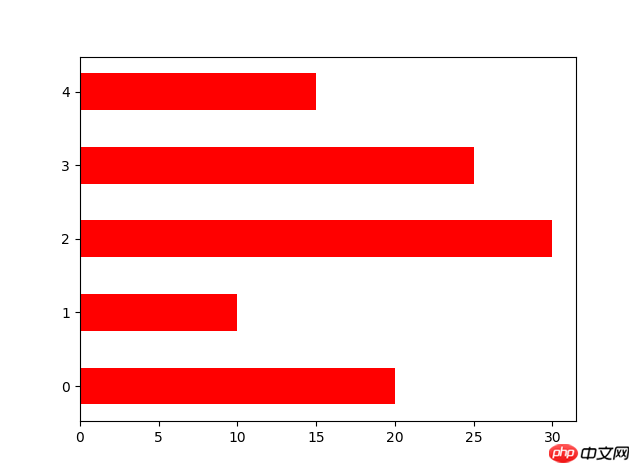
orientation set horizontal bar chart
N=5
y=[20,10,30,25,15]
y1=np.random.randint(10,50,5)
x=np.random.randint(10,1000,N)
index=np.arange(N)# plt.bar(left=index,height=y,color='red',width=0.3)# plt.bar(left=index+0.3,height=y1,color='black',width=0.3)#plt.barh() 加了h就是横向的条形图,不用设置orientation
plt.bar(left=0,bottom=index,width=y,color='red',height=0.5,orientation='horizontal')
plt.show()
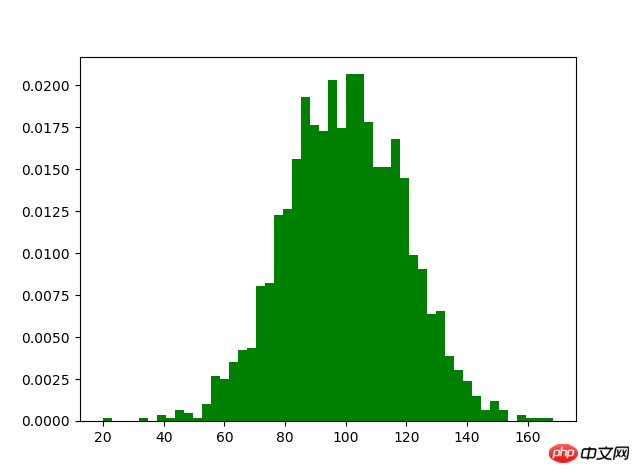
##6. Histogram
m1=100
sigma=20
x=m1+sigma*np.random.randn(2000)
plt.hist(x,bins=50,color="green",normed=True)
plt.show()
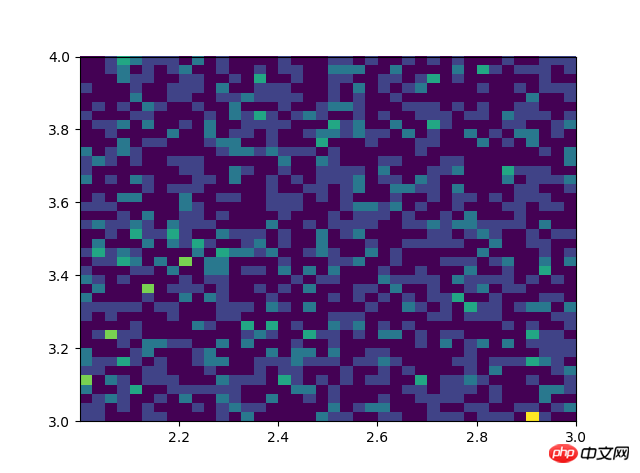
# #双变量的直方图# #颜色越深频率越高# #研究双变量的联合分布#双变量的直方图#颜色越深频率越高#研究双变量的联合分布 x=np.random.rand(1000)+2 y=np.random.rand(1000)+3 plt.hist2d(x,y,bins=40) plt.show()
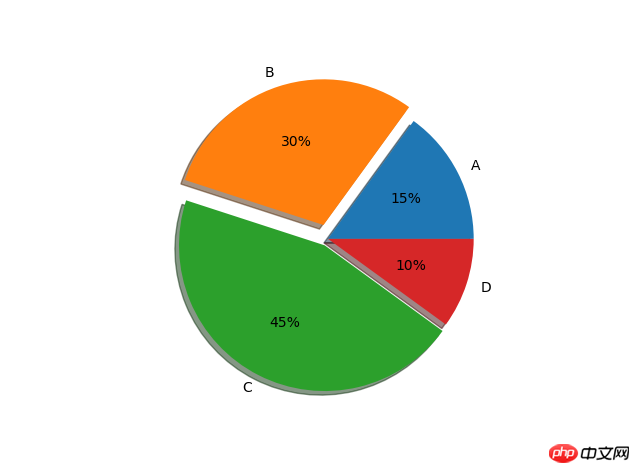
7. Pie Chart
#设置x,y轴比例为1:1,从而达到一个正的圆
#labels标签参数,x是对应的数据列表,autopct显示每一个区域占的比例,explode突出显示某一块,shadow阴影
labes=['A','B','C','D']
fracs=[15,30,45,10]
explode=[0,0.1,0.05,0]#设置x,y轴比例为1:1,从而达到一个正的圆
plt.axes(aspect=1)#labels标签参数,x是对应的数据列表,autopct显示每一个区域占的比例,explode突出显示某一块,shadow阴影
plt.pie(x=fracs,labels=labes,autopct="%.0f%%",explode=explode,shadow=True)
plt.show()
8. Box plot
import matplotlib.pyplot as pltimport numpy as npdata=np.random.normal(loc=0,scale=1,size=1000)#sym 点的形状,whis虚线的长度plt.boxplot(data,sym="o",whis=1.5)plt.show()
#sym 点的形状,whis虚线的长度
The above is the detailed content of Detailed explanation of examples of drawing graphics with python. For more information, please follow other related articles on the PHP Chinese website!


 orientation set horizontal bar chart