


虽然网上已经有多的数不清的调试教程了,但仍然没有发现哪篇文章写的通俗易懂,索性自己尝试写写自己的一些使用习惯或者说是心得,希望对那些还不是很懂得使用断点调试的孩子有一些帮助(大神请无视~)。
1. What is breakpoint debugging? Is it difficult?
Breakpoint debugging is actually not that complicated. A simple understanding of no outbound calls is to open the browser, open sources, find the js file, and click on the line number. It seems very simple to operate, but in fact many people struggle with where to break the point? (Let’s look at a breakpoint screenshot first, taking the breakpoint of the Chrome browser as an example)


Do you remember the steps?
Open the page with chrome browser → Press f12 to open the developer tools → Open Sources → Open the js code file you want to debug → In the line number Click on OK! Congratulations on hitting your virginity breakpoint, haha~~
2. How to hit the breakpoint appropriately?
The operation of breaking points is very simple. The core question is, how to set breakpoints to find out the problems in the code? Let me continue to give an example to facilitate your understanding. Without further ado, here is the picture:

## Suppose we are now implementing a function to load more, as shown in the picture above, but now there is a problem with loading more functions. The data is not loaded after clicking. At this time, we immediately thought of What should it be? (Write the answer on a different line, and you can see what your first reaction is)
The first thing I thought of was, what did I click on? did not succeed? Are the methods in the click event run? Okay, if we want to know the answer to this question, let's try setting a breakpoint immediately. Where is the breakpoint? Think about it yourself first.
Continue with the picture above:
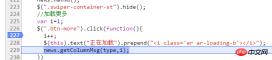
Have you thought about it? That's right, since we want to know whether the click is successful, of course we add a breakpoint at the click event in the code. Remember not to add it on line 226, because the function in the click method is executed, not the selection on line 226. device. The breakpoint is now set, what do you do next? Think about it for yourself~ Continue with the picture above: ## Then of course we go back and click the load more button, why? Forehead. . . If you ask this, please allow me to use this expression Continue to the topic, the picture above is the situation after clicking the load more button, we can see on the left The page on the side is covered by a translucent layer. There is a string of English and two buttons at the top of the page. The 227th line of code on the right is added with a background color. When this happens, let’s not worry about what those buttons mean in English. What does it do? What information did you get from this picture? Continue to think about it~ If the above situation occurs, it means that the function in the click event is called, which further illustrates that the click event takes effect. Then our first "criminal suspect" for this problem has been eliminated. We turn our attention to the inside of the event. The click event is triggered, so the next problem is its internal function problem. If you want to ask why? Please give me a piece of tofu. . . For example, I give you a pen and ask you to write. Then you write a word on the paper and find that the word does not come out. Why? You said I wrote it, but there are still scratches on the paper. Is it possible that the pen is out of ink or the nib is broken? This example is more similar to click loading. The action of writing is a click operation, and the internal function is the ink or pen tip. Do you understand~ Then let’s analyze the contents of the click event. It contains three sentences. The first sentence is to increase the variable i automatically, and the second sentence is to add to the button. An i tag, the third sentence is to call the method of requesting data. Through the functions of these three sentences, we can place a larger part of the suspicion on the third sentence, and a smaller part on the first and second sentences. , some people may wonder, how can the second sentence be suspicious? Its function is just to add a label, which has no impact on the data at all. Indeed, this sentence has no impact on the data, but for strict consideration, it may still make mistakes. For example, what if it is missing a semicolon? Or is there a symbol error inside the sentence? It's often small problems like this that waste a lot of our time. Okay, in order to further target the "criminal suspect", I would like to introduce a tool to you, which is also one of the two icons shown in the above picture, see the picture below: ##The function of this small icon is called "statement by statement execution" or "step by step" "Execute" is a term that I personally understand. It means that every time you click it, the js statement will be executed later. It also has a shortcut key, F10. The following picture demonstrates the effect after it is clicked: The fun is yet to come~ OK, keep writing! As mentioned above, I clicked the "Execute statement by statement" button twice, and the code ran from line 227 to line 229. What do you think this means? Does this mean that grammatically speaking, the first two sentences are correct? Does it also mean that the first two sentences eliminate suspicion? I don't think so. As we all know, loading more is a function of the next page, and the most core one is the page number value passed to the background. Whenever I click the load more button once , the value of the page number will be increased by 1, so if the data on the next page does not come out, is it possible that there is a problem with the page number value, which is the [i variable] (hereinafter referred to as i)? So how to check whether there is a problem with the page number? Let’s all think about it ourselves first. The following will teach you two ways to view the actual output value of the page number i], the picture above: The first method: ##The steps are as follows: 1. Still put a breakpoint on line 227 → 2. Click the Load more button → 3. Click the "Execute statement by statement" button once, and the js code will be executed to line 228 → 4. Use the mouse to select i++ (what is selected Don’t you understand? If you want to copy something, do you need to select it? Yes, this is the selection.)
→ 5. After selecting, hover the mouse over the target, and you will see the result as shown above. Second type: In the second method above, the console is mentioned. We can call it a console or anything else. It doesn’t matter. The function of the console is very powerful. During the debugging process, we often need to know what the values of certain variables are output, or whether we have selected the elements we want using a selector [$”.p”), etc., which can be printed on the console. come out. Of course, you can also use the first method directly. Let me show you how to print the elements we want to select in the console. Above~
Let me tell you my understanding of the console: This thing is a js parser, which is used by the browser itself to parse and run js, but The browser allows us developers to control the running and output of js during the debugging process through the console. Through the above two methods, you may think it is very simple to use, but I want to remind you, or it may be a confusion that some novices are more likely to encounter.
This should be a very common question for novices. Why can’t I directly output the value of the variable on the console without breaking the point? Personally, I understand that i is just a local variable at this time. If you do not set a breakpoint, the browser will parse all js. The console cannot access local variables, but only global variables, so at this time the console will report an error that i is not available. Definition, but when js sets a breakpoint, the console resolves to the function where the local variable i is located, and i can be accessed at this time. It's very simple. The console itself is a js parser, and $(".xxx") is a js statement, so naturally the console can parse this statement and output the result. After introducing the usage of the "Statement-by-Statement Execution" button and the console, I will finally introduce a button, as shown above: I call this button the "Procedure-by-Procedure Execution" button, which is different from the "Statement-by-Statement Execution" button. The "Execute step by step" button is often used when one method calls multiple js files, and the js code involved is relatively long, this button will be used. Above picture: ## Assume that in the above picture I only set a breakpoint on line 227, and then clicked the "Execute Statement by Statement" button all the way to line 229. At this time, what if I click the "Execute Statement by Statement" button again? Then I will enter In the js in the picture below: These are all It's the content of the zepto library file, and it's very complicated to run. We can't always use the "Execute statement by statement" button, so you will find that you are still in the library file after pressing it for a long time. What to do? Then the "Process-by-Process" button comes into play.
# In addition to hitting a breakpoint on line 227, I also hit a breakpoint on line 237. When we run to line 229 , directly click the "Execute step by step" button, you will find that js directly skips the library file and runs to line 237. You can use it and experience it yourself. This article mainly introduces "statement-by-statement execution ” button, “Process-by-process execution” button, console console, and some ideas when debugging bugs. I won’t go into details about the usage of the tool. It’s enough for everyone to know how to use it. How to use it more rationally requires everyone to summarize and improve it through a lot of practice~ I actually wrote in this article The main thing I want to talk about is an idea for debugging bugs, but the selected example involves too many things. . . I'm afraid that writing it all down would be too long and no one would be interested in reading it, so I simply selected a part to explain to you. I don't know if you will gain anything from it. Don't look at the three sentences I wrote about debugging. If you actually do it like me in an actual project, it is estimated that the time you spend debugging a bug will be much longer than the time it takes to write a script. . . In actual situations, we should develop the habit of checking the problem in our mind as soon as we get the problem, and find the most likely point where the problem occurs. If there is no way to quickly find out the most important point, then you can use the most A troublesome but reliable method is to use the "Execute statement by statement" button to execute the entire js related to the problem in sequence. During the execution process, you can also clarify your ideas and pay attention to the value and selection of each variable. Whether the element selected by the tool is correct. Generally speaking, if you do this again, the bugs will be almost solved. OK~ That’s it for breaking points~ If you don’t understand, you can leave a message below~ And if you have any knowledge points that you don’t understand or are confused about the front-end, You can also leave a message below. When I have time, I will continue to write some documents for everyone’s messages~ ##
## . How can I trigger a click event without clicking the load more button? How to execute the function in the click event without triggering the click event? Roaring. . But I believe that everyone will not ask such a low question~ No nonsense~


 ##Enter $ in the console (this), you can get the selected element. Yes, it is the object we clicked - the load more button element.
 Confusion 1: When there is no break point, enter i in the console, and the console reports an error.
Confusion 2: Why can things be printed when I directly enter $(".xxx") in the console?


Final summary:
So personally think that our idea of debugging bugs should be like this: first, whether js is successfully executed; secondly, whether there is logic in js Problems, variable problems, parameter problems, etc.; finally, if there are no problems with the above, please look carefully at the various symbols. . .
The above is the detailed content of How to use js for breakpoint debugging?. For more information, please follow other related articles on the PHP Chinese website!

 Behind the Scenes: What Language Powers JavaScript?Apr 28, 2025 am 12:01 AM
JavaScript runs in browsers and Node.js environments and relies on the JavaScript engine to parse and execute code. 1) Generate abstract syntax tree (AST) in the parsing stage; 2) convert AST into bytecode or machine code in the compilation stage; 3) execute the compiled code in the execution stage.
 The Future of Python and JavaScript: Trends and PredictionsApr 27, 2025 am 12:21 AM
The future trends of Python and JavaScript include: 1. Python will consolidate its position in the fields of scientific computing and AI, 2. JavaScript will promote the development of web technology, 3. Cross-platform development will become a hot topic, and 4. Performance optimization will be the focus. Both will continue to expand application scenarios in their respective fields and make more breakthroughs in performance.
 Python vs. JavaScript: Development Environments and ToolsApr 26, 2025 am 12:09 AM
Both Python and JavaScript's choices in development environments are important. 1) Python's development environment includes PyCharm, JupyterNotebook and Anaconda, which are suitable for data science and rapid prototyping. 2) The development environment of JavaScript includes Node.js, VSCode and Webpack, which are suitable for front-end and back-end development. Choosing the right tools according to project needs can improve development efficiency and project success rate.
 Is JavaScript Written in C? Examining the EvidenceApr 25, 2025 am 12:15 AM
Yes, the engine core of JavaScript is written in C. 1) The C language provides efficient performance and underlying control, which is suitable for the development of JavaScript engine. 2) Taking the V8 engine as an example, its core is written in C, combining the efficiency and object-oriented characteristics of C. 3) The working principle of the JavaScript engine includes parsing, compiling and execution, and the C language plays a key role in these processes.
 JavaScript's Role: Making the Web Interactive and DynamicApr 24, 2025 am 12:12 AM
JavaScript is at the heart of modern websites because it enhances the interactivity and dynamicity of web pages. 1) It allows to change content without refreshing the page, 2) manipulate web pages through DOMAPI, 3) support complex interactive effects such as animation and drag-and-drop, 4) optimize performance and best practices to improve user experience.
 C and JavaScript: The Connection ExplainedApr 23, 2025 am 12:07 AM
C and JavaScript achieve interoperability through WebAssembly. 1) C code is compiled into WebAssembly module and introduced into JavaScript environment to enhance computing power. 2) In game development, C handles physics engines and graphics rendering, and JavaScript is responsible for game logic and user interface.
 From Websites to Apps: The Diverse Applications of JavaScriptApr 22, 2025 am 12:02 AM
JavaScript is widely used in websites, mobile applications, desktop applications and server-side programming. 1) In website development, JavaScript operates DOM together with HTML and CSS to achieve dynamic effects and supports frameworks such as jQuery and React. 2) Through ReactNative and Ionic, JavaScript is used to develop cross-platform mobile applications. 3) The Electron framework enables JavaScript to build desktop applications. 4) Node.js allows JavaScript to run on the server side and supports high concurrent requests.
 Python vs. JavaScript: Use Cases and Applications ComparedApr 21, 2025 am 12:01 AM
Python is more suitable for data science and automation, while JavaScript is more suitable for front-end and full-stack development. 1. Python performs well in data science and machine learning, using libraries such as NumPy and Pandas for data processing and modeling. 2. Python is concise and efficient in automation and scripting. 3. JavaScript is indispensable in front-end development and is used to build dynamic web pages and single-page applications. 4. JavaScript plays a role in back-end development through Node.js and supports full-stack development.


Hot AI Tools

Undresser.AI Undress
AI-powered app for creating realistic nude photos

AI Clothes Remover
Online AI tool for removing clothes from photos.

Undress AI Tool
Undress images for free

Clothoff.io
AI clothes remover

Video Face Swap
Swap faces in any video effortlessly with our completely free AI face swap tool!

Hot Article
Hot Tools

SublimeText3 Chinese version
Chinese version, very easy to use

Safe Exam Browser
Safe Exam Browser is a secure browser environment for taking online exams securely. This software turns any computer into a secure workstation. It controls access to any utility and prevents students from using unauthorized resources.

EditPlus Chinese cracked version
Small size, syntax highlighting, does not support code prompt function

SublimeText3 Linux new version
SublimeText3 Linux latest version

SecLists
SecLists is the ultimate security tester's companion. It is a collection of various types of lists that are frequently used during security assessments, all in one place. SecLists helps make security testing more efficient and productive by conveniently providing all the lists a security tester might need. List types include usernames, passwords, URLs, fuzzing payloads, sensitive data patterns, web shells, and more. The tester can simply pull this repository onto a new test machine and he will have access to every type of list he needs.

