
 Web Front-endH5 TutorialDetailed introduction to the application of HTML5 technology in new energy fields such as wind power and photovoltaics (picture)
With the rise of a new round of industrial revolution, addressing climate change has increasingly become a global consensus, and energy technology is becoming the driving force to lead the transformation of the energy industry and achieve innovation-driven development. From the world to China, the new energy industry represented by wind energy and photovoltaic power generation has developed rapidly. The integration of renewable energy power generation and modern power grids has become the core of the world's sustainable energy transformation. Power generation technology continues to follow the path of large-scale, high efficiency and low power generation. Costs continue to improve, and China has ranked first in the world in terms of cumulative installed capacity and newly installed capacity in the fields of wind energy and photovoltaic power generation.
Compared with the stable and controllable production methods of traditional energy, wind energy and solar energy are inherently unpredictable and depend on the weather to a large extent. Therefore, building a system that integrates the Internet of Things, big data, The new energy equipment management platform integrated with cloud computing improves the "energy availability" and "time availability" of the equipment, becoming the key to upgrading and transforming the operation management methods of the enterprise itself and even the entire new energy industry. It is indispensable. is an important part of front-end big data visualization.
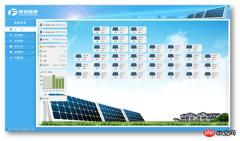
The following is a screenshot of the Web SCADA photovoltaic power station intelligent management solution system implemented by Zhichuang Energy Company many years ago based on HT for Web technology:

#HTML5 based on HT for Web In addition to its application in traditional telecommunications, electric power and industrial control fields (see "Web SCADA Industrial Control Based on HT for Web" "Mobile Application"), has now been widely used in new energy fields such as wind power and photovoltaics. HT for Web based on Web technology is naturally the preferred solution for PaaS and SaaS cloud platform services for IoT monitoring. Here we will be based on one of the first domestic Using the Azure IoT suite on the Microsoft Smart Cloud and integrating the Tupu software HT for Web front-end graphical interface component Middleware, we successfully created a photovoltaic monitoring interface for the Power+ IoT monitoring cloud big data platform as an example, for everyone Introducing this system front-end technology that has been applied to more than 1,000 wind turbines and more than 5,000 photovoltaic inverters and combiner boxes across the country.
The final rendering effect of the page we will introduce in detail is as follows, use the example in the HT for Web official website example center to experience it.


These two data values are hard-coded in the demo, but in actual operation, the data is transmitted through the background. In recent years, more and more real-time monitoring systems based on HTML5 have Using the WebSocket solution, real-time data acquisition has been achieved, and the customer in this case is no exception. As mentioned earlier, they adopted the Azure IoT suite of Microsoft Smart Cloud, so they adopted .NET-based ASP.NETSignalR is naturally the WebSocket framework solution they adopted.
function createDatas() {
    json = JSON.parse(basicData);
    json.result.forEach(function(data) {        var node = new ht.Node();
        node.setImage('symbols/enjoy/pv/pv-box.json');
        node.s({            'select.color': 'white',            '2d.selectable': false
        });
        node.a({
            deviceName: data.deviceName,
            capacity: data.capacity + 'KW',
            raw_capacity: data.capacity
        });
        node.setTag(data.deviceCode);
        graphView.getDataModel().add(node);
    });
}
When the page opens, the system first constructs hundreds of combiner box primitives based on the basicData information in the CreateData function, and passes node.setImage('symbols /enjoy/pv/pv-box.json'); Set the graphics element to the combiner box vector we constructed, and then use the simple extended layout algorithm in the example to matrix layout hundreds of combiner box devices. Of course, you will encounter You can use HT's automatic layout to arrange complex network topology diagrams:
One thing to note here is that we set the tag of each graphic element through node.setTag(data.deviceCode) when building the graphic elements. Tag tag, this is very important. This is used to quickly find the corresponding graphic element and prepare for data update.
function fillDatas() {
var hlx_state_0 = hlx_state_1 = hlx_state_2 = hlx_state_3 = 0;
var zc_state_1 = zc_state_2 = zc_state_3 = 0;

    json = JSON.parse(realTimeData);
    json.result.wtrtDatas.forEach(function(data) {
        var comboxRTDto = data.comboxRTDto;
        var node = graphView.getDataModel().getDataByTag(comboxRTDto.deviceCode);
        if (node) {
            var hlxState = comboxRTDto.pvDeviceStCode;
            node.a({
                hlxState: hlxStateMap[hlxState],
                discreteRate: comboxRTDto.discreteRate + '%',
                outputPower: comboxRTDto.outputPower + 'KW',
                percentage:  comboxRTDto.outputPower / node.a('raw_capacity')
            });
        }
    });
}
After the above work is completed, the interface can already display all photovoltaic combiner box equipment, but the parameter information displayed by each equipment is the initialization set when we build the vector icon. It is not a real real-time running value, so we need to update the data of the graphics element based on the data pushed in real time from the background. In the above fillData function, we parse the realTimeData data, and then traverse the data of each combiner box, through dataModel.getDataByTag(deviceCode ) Find the corresponding primitive and set the corresponding attr attributes. Since these attributes have been bound to the corresponding graphic parameters during vector design, when all the data is set, each corresponding combiner box on the topology map can automatically Real real-time data is displayed.
In this example, we only updated the real-time data once, but a normal system will poll for a few seconds through AJAX, or use WebSocket to push the data from the background to the front-end in real time when there are changes, and then call fillDatas multiple times. function to update the data. In addition, the content of this interface scene is dynamically constructed after the first basicData query. If you already have the JSON data serialized by the topology map, you only need to deserialize it to build the topology map scene. Serialization and deserialization
After completing the above, we have only completed half of the work. Remember that we still have a summary and filtering panel in the upper part:

When I first started looking at this design draft, I naturally thought that the panel and operation buttons could be done using the Panel component of HT for Web: www.hightopo.com/guide/guide/plugin/form/ ht-form-guide.html, but then I thought about the fact that the style of general components is relatively fixed, and even if the effect is customized, it is difficult to cope with the changing needs. I suddenly thought that we can still use the GraphView topology component of HT for Web to do it. In this matter, the text above is nothing more than ht.Text primitives, Progress bar is a Node node with a shape type of rect, and the filter control button is actually just a bunch of Node primitives, but we set Different background colors, center the label label, and change the element selection effect from the border to the shadow selection effect, and you are done. Moreover, since it is a topological map layout, users can change the layout position or interface style regardless of changes in requirements. It can be easily dragged and dropped, and new style parameters can be set to meet changing business display needs
function createHeader() {
    header = new ht.graph.GraphView();
    ht.Default.xhrLoad('displays/enjoy/pv/pv-header.json', function(json) {
        header.getDataModel().deserialize(json);
        header.getDataModel().setBackground(undefined);
        createDatas();
        fillDatas();
        layoutDatas();
    });
    header.setInteractors(null);
    var handleClick = function(e) {
    if (!graphView.getView().contains(e.target)) {
    var data = header.getDataAt(e);
            header.sm().ss(data);
        }
    };
    document.body.addEventListener('mousedown', handleClick, false);
    document.body.addEventListener('touchstart', handleClick, false);
}
汇总部分就是有以上 createHeader 函数搞定,注意这里我们通过 ht.Default.xhrLoad('displays/enjoy/pv/pv-header.json 直接加载已经序列化好的拓扑图信息,然后由于该汇总面板唯一需要的交互就是点击选中分类按钮进行过滤,于是我们通过 header.setInteractors(null); 直接关闭了所有 HT for Web 的默认交互,然后通过添加 mousedown 和 touchstart 的原生 HTML 监听事件自定义交互逻辑,这里只需要通过 header.getDataAt(event) 传入不管是 touch 还是 mouse 事件,HT 自动回返回当前操作点下的图元,后续过滤已经动画的逻辑比较简单,这里就不展开说明了,有兴趣的可以改造成更带感的过滤动画布局效果,可参考《透过WebGL 3D看动画Easing函数本质》一文了解 HT for Web 的各种预制的动画功能。
这里我们仅演示了光伏的一个页面效果,风电的风机也可以采用类似的方式呈现,这个上万个矢量风机实时转动的 HTML5 性能效果,也可以结合例如百度地图、OpenLayers 或 GoogleMap 等地图方案呈现风机或光伏监控画面:


对于看腻了 2D 矢量风机的,这个采用 HT for Web 实现的 3D 可旋转风机 HTML5 的代码也就寥寥几十行,今天篇幅有限先不展开介绍了,大家就先玩玩 demo 。

The above is the detailed content of Detailed introduction to the application of HTML5 technology in new energy fields such as wind power and photovoltaics (picture). For more information, please follow other related articles on the PHP Chinese website!

 html5的div一行可以放两个吗Apr 25, 2022 pm 05:32 PM
html5的div元素默认一行不可以放两个。div是一个块级元素,一个元素会独占一行,两个div默认无法在同一行显示;但可以通过给div元素添加“display:inline;”样式,将其转为行内元素,就可以实现多个div在同一行显示了。
 html5中列表和表格的区别是什么Apr 28, 2022 pm 01:58 PM
html5中列表和表格的区别:1、表格主要是用于显示数据的,而列表主要是用于给数据进行布局;2、表格是使用table标签配合tr、td、th等标签进行定义的,列表是利用li标签配合ol、ul等标签进行定义的。
 html5怎么让头和尾固定不动Apr 25, 2022 pm 02:30 PM
固定方法:1、使用header标签定义文档头部内容,并添加“position:fixed;top:0;”样式让其固定不动;2、使用footer标签定义尾部内容,并添加“position: fixed;bottom: 0;”样式让其固定不动。
 HTML5中画布标签是什么May 18, 2022 pm 04:55 PM
HTML5中画布标签是“<canvas>”。canvas标签用于图形的绘制,它只是一个矩形的图形容器,绘制图形必须通过脚本(通常是JavaScript)来完成;开发者可利用多种js方法来在canvas中绘制路径、盒、圆、字符以及添加图像等。
 html5中不支持的标签有哪些Mar 17, 2022 pm 05:43 PM
html5中不支持的标签有:1、acronym,用于定义首字母缩写,可用abbr替代;2、basefont,可利用css样式替代;3、applet,可用object替代;4、dir,定义目录列表,可用ul替代;5、big,定义大号文本等等。
 html5废弃了哪个列表标签Jun 01, 2022 pm 06:32 PM
html5废弃了dir列表标签。dir标签被用来定义目录列表,一般和li标签配合使用,在dir标签对中通过li标签来设置列表项,语法“<dir><li>列表项值</li>...</dir>”。HTML5已经不支持dir,可使用ul标签取代。
 Html5怎么取消td边框May 18, 2022 pm 06:57 PM
3种取消方法:1、给td元素添加“border:none”无边框样式即可,语法“td{border:none}”。2、给td元素添加“border:0”样式,语法“td{border:0;}”,将td边框的宽度设置为0即可。3、给td元素添加“border:transparent”样式,语法“td{border:transparent;}”,将td边框的颜色设置为透明即可。
 html5是什么意思Apr 26, 2021 pm 03:02 PM
html5是指超文本标记语言(HTML)的第五次重大修改,即第5代HTML。HTML5是Web中核心语言HTML的规范,用户使用任何手段进行网页浏览时看到的内容原本都是HTML格式的,在浏览器中通过一些技术处理将其转换成为了可识别的信息。HTML5由不同的技术构成,其在互联网中得到了非常广泛的应用,提供更多增强网络应用的标准机。


Hot AI Tools

Undresser.AI Undress
AI-powered app for creating realistic nude photos

AI Clothes Remover
Online AI tool for removing clothes from photos.

Undress AI Tool
Undress images for free

Clothoff.io
AI clothes remover

AI Hentai Generator
Generate AI Hentai for free.

Hot Article
Hot Tools

MinGW - Minimalist GNU for Windows
This project is in the process of being migrated to osdn.net/projects/mingw, you can continue to follow us there. MinGW: A native Windows port of the GNU Compiler Collection (GCC), freely distributable import libraries and header files for building native Windows applications; includes extensions to the MSVC runtime to support C99 functionality. All MinGW software can run on 64-bit Windows platforms.

DVWA
Damn Vulnerable Web App (DVWA) is a PHP/MySQL web application that is very vulnerable. Its main goals are to be an aid for security professionals to test their skills and tools in a legal environment, to help web developers better understand the process of securing web applications, and to help teachers/students teach/learn in a classroom environment Web application security. The goal of DVWA is to practice some of the most common web vulnerabilities through a simple and straightforward interface, with varying degrees of difficulty. Please note that this software

SecLists
SecLists is the ultimate security tester's companion. It is a collection of various types of lists that are frequently used during security assessments, all in one place. SecLists helps make security testing more efficient and productive by conveniently providing all the lists a security tester might need. List types include usernames, passwords, URLs, fuzzing payloads, sensitive data patterns, web shells, and more. The tester can simply pull this repository onto a new test machine and he will have access to every type of list he needs.

WebStorm Mac version
Useful JavaScript development tools

SublimeText3 Linux new version
SublimeText3 Linux latest version

