Home >WeChat Applet >WeChat Development >Detailed explanation of EgretWing link WeChat development tool debugging issues
Detailed explanation of EgretWing link WeChat development tool debugging issues
- 高洛峰Original
- 2018-05-10 17:01:396095browse
EgretWing links WeChat development tool debugging issues
The EgretWing compiler supports three debugging modes, Node.js, Chrome, and EgretWing extension development.
Tool configuration errors may be encountered during the development process.
This requires reconfiguring the tool path in the configuration file launch.json in EgretWing.
Create Egret project debugTest [Egret 2D Project Wizard]

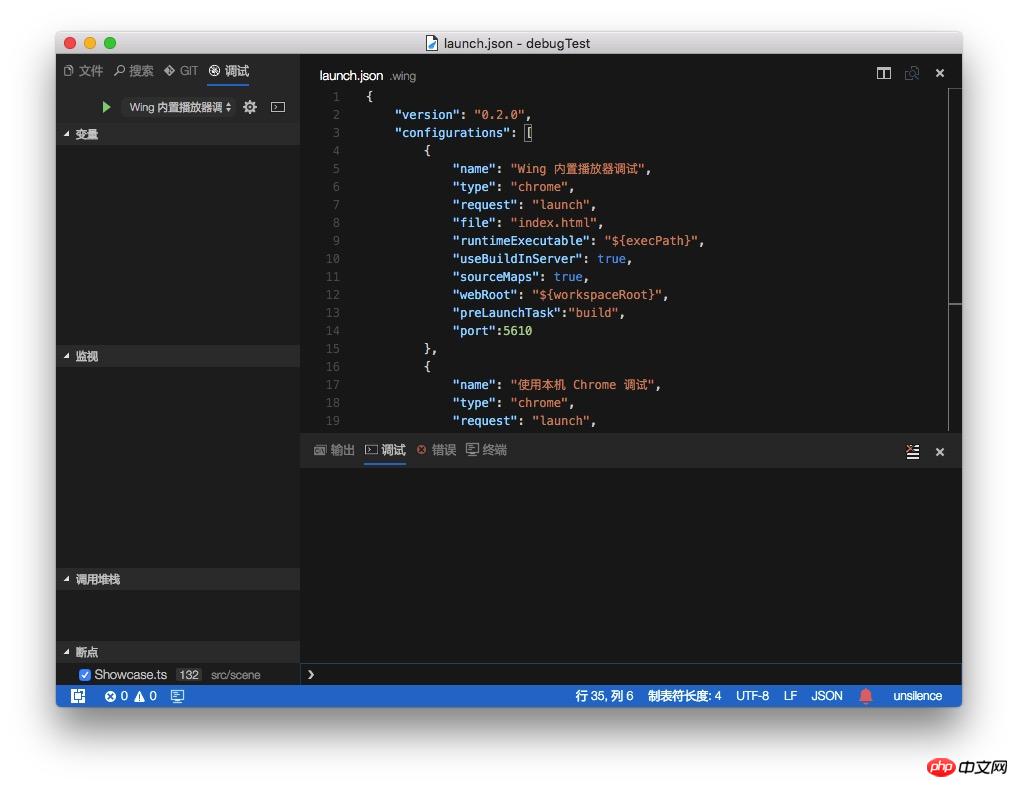
{
    "version": "0.2.0",
    "configurations": [
        {
            "name": "Wing 内置播放器调试",
            "type": "chrome",
            "request": "launch",
            "file": "index.html",
            "runtimeExecutable": "${execPath}",
            "useBuildInServer": true,
            "sourceMaps": true,
            "webRoot": "${workspaceRoot}",
            "preLaunchTask":"build",
            "port":5610
        },
        {
            "name": "使用本机 Chrome 调试",
            "type": "chrome",
            "request": "launch",
            "file": "index.html",
            "runtimeExecutable": "/Applications/Google Chrome.app/Contents/MacOS/Google Chrome",
            "useBuildInServer": true,
            "sourceMaps": true,
            "webRoot": "${workspaceRoot}",
            "preLaunchTask":"build",
            "port":5610
        },
        {
            "name": "附加到 Chrome 进程",
            "type": "chrome",
            "request": "attach",
            "port": 9222,
            "webRoot": "${workspaceRoot}"
        }
    ]}
Click to debug as shown below:

- launch.json Introduction
- name Configuration name; displayed in the drop-down list of startup configurations. Wing built-in player debugging, debugging using native Chrome, attaching to Chrome process.
- type EgretWing configuration type, chrome, node, extensionHost.
- request The configured Request type. Valid values are "launch" or "attach".
- file debug entry file, an html file opened in the browser.
- runtimeExecutable The absolute path of the executable file. The default is the runtime executable on PATH. Change to your Chrome installation path such as C:\Program Files (x86)\Google\Chrome\Application\chrome.exe or /Applications/Google Chrome.app/Contents/MacOS/Google Chrome.
- useBuildInServer When true, EgretWing will start a built-in web server.
- sourceMaps Whether to use JavaScript source maps (if present).
- webRoot The root directory of the web service.
- preLaunchTask Task that is run before executing the task.
- port The port number specified by the web server.
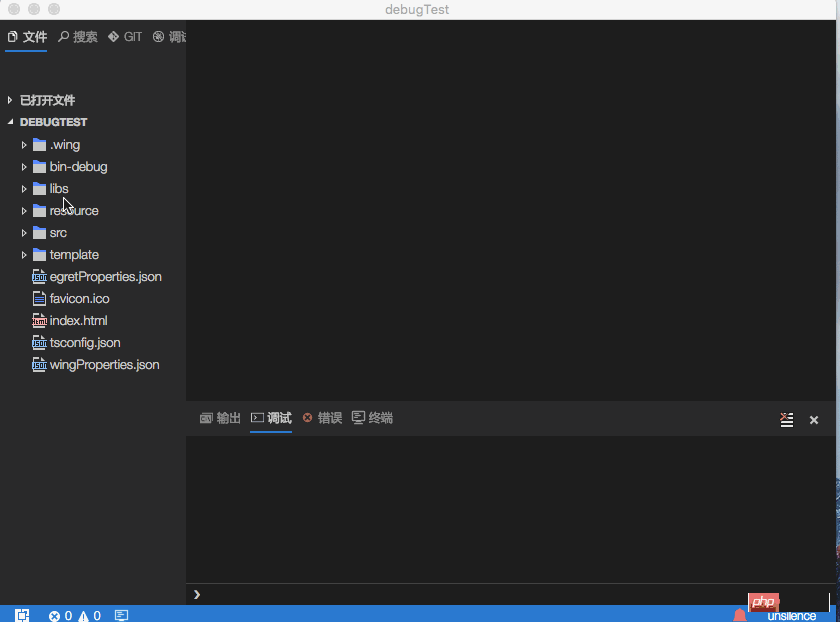
- The operation is demonstrated as follows:

The above is the detailed content of Detailed explanation of EgretWing link WeChat development tool debugging issues. For more information, please follow other related articles on the PHP Chinese website!
Statement:
The content of this article is voluntarily contributed by netizens, and the copyright belongs to the original author. This site does not assume corresponding legal responsibility. If you find any content suspected of plagiarism or infringement, please contact admin@php.cn
Previous article:Introduction to WeChat enterprise account development to obtain user informationNext article:Introduction to WeChat enterprise account development to obtain user information
Related articles
See more- Detailed explanation and simple usage of WeChat mini program textarea
- PHP WeChat public account development (2) Baidu BAE construction and database use
- php WeChat public account development (3) php implements simple WeChat text communication
- php WeChat public account development (4) php implements custom keyword reply
- PHP version of WeChat store calling api sample code

