Home >Backend Development >C#.Net Tutorial >.Net garbage collection mechanism principle (2)
.Net garbage collection mechanism principle (2)
- 黄舟Original
- 2017-02-17 11:20:181528browse
English original text: Jeffrey Richter
Compiled by: Zhao Yukai
Link http://www.php.cn/
The previous article introduced the basic principles of .Net garbage collection and the internal mechanism of garbage collection to execute the Finalize method; in this article we look at weak reference objects, generations, multi-threaded garbage collection, large object processing and garbage collection related performance counters.
Let's start with weak reference objects. Weak reference objects can reduce the memory pressure caused by large objects.
Weak References
When the root object of the program points to an object, the object is reachable and the garbage collector cannot recycle it. This is called a strong reference to the object. . The opposite of strong references is weak references. When there is a weak reference on an object, the garbage collector can reclaim the object, but it also allows the program to access the object. What's going on? Please read below.
If there are only weak references on an object and the garbage collector is running, the object will be recycled. If the object is accessed later in the program, the access will fail. On the other hand, to use a weakly referenced object, the program must first make a strong reference to the object. If the program makes a strong reference to the object before the garbage collector collects the object, then (after having a strong reference) the garbage collector will This object cannot be recycled. This is a bit convoluted, let's use a piece of code to explain it:
void Method() {
//创建对象的强引用
Object o = new Object();
// 用一个短弱引用对象弱引用o.
WeakReference wr = new WeakReference(o);

o = null; // 移除对象的强引用

o = wr.Target; //尝试从弱引用对象中获得对象的强引用
if (o == null) {
// 如果对象为空说明对象已经被垃圾回收器回收掉了
} else {
// 如果垃圾回收器还没有回收此对象就可以继续使用对象了
}
}
Why do we need weak objects? Because some data is easy to create, but requires a lot of memory. For example: you have a program that needs to access all folders and file names on the user's hard disk; you can access the user's disk to generate data once when the program needs this data for the first time. After the data is generated, you can access the data in the memory. Data is used to obtain user file data instead of reading the disk to obtain data every time. This can improve the performance of the program.
问题是这个数据可能相当大,需要相当大的内存。如果用户去操作程序的另外一部分功能了,这块相当大的内存就没有占用的必要了。你可以通过代码删除这些数据,但是如果用户马上切换到需要这块数据的功能上,你就必须重新从用户的磁盘上构建这个数据。弱引用为这种场景提供了一种简单有效的方案。
当用户切换到其他功能时,你可以为这个数据创建一个弱引用对象,并把对这个数据的强引用解除掉。这样如果程序占用的内存很低,垃圾回收操作就不会触发,弱引用对象就不会被回收掉;这样当程序需要使用这块数据时就可以通过一个强引用来获得数据,如果成功得到了对象引用,程序就没有必要再次读取用户的磁盘了。
WeakReference类型提供了两个构造函数:
WeakReference(object target);
WeakReference(object target, bool trackResurrection);
target参数显然就是弱引用要跟踪的对象了。trackResurrection参数表示当对象的Finalize方法执行之后是否还要跟踪这个对象。默认这个参数是false。有关对象的复活请参考这里。
For convenience, weak references that do not track the resurrection object are called "short weak references"; while weak references that want to track the resurrection objects are called "long weak references". If the object does not implement the Finalize method, then the long weak reference and the short weak reference are exactly the same. It is strongly recommended that you try to avoid using long weak references. Long weak references allow you to use resurrected objects whose behavior may be unpredictable.
Once you use WeakReference to reference an object, it is recommended that you set all strong references of this object to null; if a strong reference exists, the garbage collector will never be able to reclaim the object pointed to by the weak reference.
When you want to use a weak reference to the target object, you must create a strong reference for the target object. This is very simple, just use object a = weekRefer.Target; and then you must determine whether a is empty or weak. You can continue to use it only if it is not empty. If it is weakly empty, it means that the object has been recycled by the garbage collector, and you must reacquire the object through other methods.
Internal implementation of weak references
From the previous description, we can infer that weak reference objects are definitely handled differently from general objects. Generally speaking, if an object refers to another object, it is a strong reference, and the garbage collector cannot recycle the referenced object. However, this is not the case for the WeakReference object. The object it refers to may be recycled.
To fully understand how weak objects work, we also need to take a look at the managed heap. There are two internal data structures on the managed heap. Their only role is to manage weak references: we can call them long weak reference tables and short weak reference tables; these two tables store weak reference target object pointers on the managed heap.
At the beginning of the program running, both tables are empty. When you create a WeakReference object, the object is not allocated on the managed heap, but an empty slot (Empty Slot) is created in the weak object table. Short weak reference objects are placed in the short weak object table, and long weak reference objects are placed in the long weak reference table.
Once an empty slot is found, the value of the empty slot will be set to the address of the weak reference target object; obviously the objects in the long and short weak object tables will not be used as the root object of the application. The garbage collector will not collect data in the long and short weak object tables.
Let's take a look at what happens when garbage collection is executed:
1. The garbage collector builds a reachable object graph. Please refer to the construction steps above
2. The garbage collector scans the short and weak object table , if the object pointed to in the weak object table is not in the reachable object graph, then the object is marked as a garbage object, and then the object pointer in the short object table is set to null
3. Garbage collector scan Termination queue (see above), if the object in the queue is not in the reachable object graph, the object is moved from the termination queue to the Freachable queue. At this time, the object is marked as a reachable object and is no longer garbage.
4. The garbage collector scans the long weak reference table. If the object in the table is not in the reachable object graph (the reachable object graph includes objects in the Freachable queue), set the corresponding object pointer in the long reference object table to null
5. The garbage collector moves the reachable object
Once you understand the working process of the garbage collector, it is easy to understand how weak references work. Accessing the Target property of WeakReference causes the system to return the target object pointer in the weak object table. If it is null, it means that the object has been recycled.
Short weak references do not track resurrections, which means that the garbage collector can check whether the object pointed to in the weak reference table is a garbage object before scanning the finalization queue.
The long weak reference tracks the resurrected object, which means that the garbage collector must set the pointer in the weak reference table to null after confirming that the object is recycled.
Generation:
When it comes to .Net garbage collection, C++ or C programmers may wonder whether there will be performance problems in managing memory in this way. GC developers are constantly tweaking the garbage collector to improve its performance. Generation is a mechanism to reduce the impact of garbage collection on performance. The garbage collector will assume that the following statements are true when working:
1. The newer an object is, the shorter the life cycle of the object is.
2. The older the object is, the shorter the life cycle of the object is. The longer
3. New objects are usually more likely to have reference relationships with new objects
4. Compressing a part of the heap is faster than compressing the entire heap
Of course, a lot of research has proven that the above assumptions are This is true in many procedures. So let's talk about how these assumptions affect the work of the garbage collector.
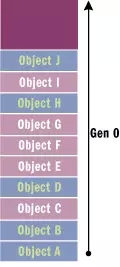
At program initialization time, there are no objects on the managed heap. At this time, the objects newly added to the managed heap are of generation 0. As shown in the figure below, objects of generation 0 are the youngest objects, and they have never been checked by the garbage collector.

Figure 1 Generation 0 objects on the managed heap
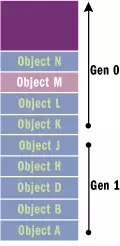
Now if more are added to the heap Objects, garbage collection will be triggered when the heap fills up. When the garbage collector analyzes the managed heap, it builds a graph of garbage objects (light purple blocks in Figure 2) and non-garbage objects. All objects that have not been recycled will be moved and compressed to the bottom of the heap. These objects that have not been recycled become generation 1 objects, as shown in Figure 2

Figure 2 Managed Heap Generation 0 and 1 objects on the heap
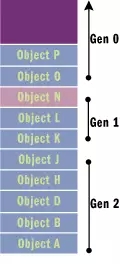
When more objects are allocated on the heap, the new objects are placed in the generation 0 area. If the Generation 0 heap fills up, a garbage collection will be triggered. At this time, the surviving objects become 1st generation objects and are moved to the bottom of the heap; after garbage collection occurs, the surviving objects in the 1st generation objects will be promoted to 2nd generation objects and moved and compressed. As shown in Figure 3:

Figure 3 Generation 0, 1, and 2 objects on the managed heap
2代对象是目前垃圾回收器的最高代,当再次垃圾回收时,没有回收的对象的代数依然保持2.
垃圾回收分代为什么可以优化性能
如前所述,分代回收可以提高性能。当堆填满之后会触发垃圾回收,垃圾回收器可以只选择0代上的对象进行回收,而忽略更高代堆上的对象。然而,由于越年轻的对象生命周期越短,因此,回收0代堆可以回收相当多的内存,而且回收所耗的性能也比回收所有代对象要少得多。
这是分代垃圾回收的最简单优化。分代回收不需要便利整个托管堆,如果一个根对象引用了一个高代对象,那么垃圾回收器可以忽略高代对象和其引用对象的遍历,这会大大减少构建可达对象图的时间。
如果回收0代对象没有释放出足够的内存,垃圾回收器会尝试回收1代和0代堆;如果仍然没有获得足够的内存,那么垃圾回收器会尝试回收2,1,0代堆。具体会回收那一代对象的算法不是确定的,微软会持续做算法优化。
多数堆(像c-runtime堆)只要找到足够的空闲内存就分配给对象。因此,如果我连续分配多个对象时,这些对象的地址空间可能会相差几M。然而在托管堆上,连续分配的对象的内存地址是连续的。
前面的假设中还提到,新对象之间更可能存在相互引用关系。因此新对象分配到连续的内存上,你可以获得就近引用的性能优化(you gain performance from locality of reference)。这样的话很可能你的对象都在CPU的缓存中,这样CPU的很多操作就不需要去存取内存了。
微软的性能测试显示托管堆的分配速度比标准的win32 HeapAlloc方法还要快。这些测试也显示了200MHz的Pentium的CPU做一次0代回收时间可以小于1毫秒。微软的优化目的是让垃圾回收耗用的时间小于一次普通的页面错误。
使用System.GC类控制垃圾回收
类型System.GC运行开发人员直接控制垃圾回收器。你可以通过GC.MaxGeneration属性获得GC的最高代数,目前最高代是定值2.
你可以调用GC.Collect()方法强制垃圾回收器做垃圾回收,Collect方法有两个重载:
void GC.Collect(Int32 generation)

void GC.Collect()
第一个方法允许你指定要回收那一代。你可以传0到GC.MaxGeneration的数字做参数,传0只做0代堆的回收,传1会回收1代和0代堆,而传2会回收整个托管堆。而无参数的方法调用GC.Collect(GC.MaxGeneration)相当于整个回收。
在通常情况下,不应该去调用GC.Collect方法;最好让垃圾回收器按照自己的算法判断什么时候该调用Collect方法。尽管如此,如果你确信比运行时更了解什么时候该做垃圾回收,你就可以调用Collect方法去做回收。比如说程序可以在保存数据文件之后做一次垃圾回收。比如你的程序刚刚用完一个长度为10000的大数组,你不再需要他了,就可以把它设置为null然后执行垃圾回收,缓解内存的压力。
GC还提供了WaitForPendingFinalizers方法。这个方法简单的挂起执行线程,知道Freachable队列中的清空之后,执行完所有队列中的Finalize方法之后才继续执行。
GC还提供了两个方法用来返回某个对象是几代对象,他们是
Int32 GC.GetGeneration(object o);

Int32 GC.GetGeneration(WeakReference wr)
第一个方法返回普通对象是几代,第二个方法返回弱引用对象的代数。
下面的代码可以帮助你理解代的意义:
private static void GenerationDemo() {
// Let's see how many generations the GCH supports (we know it's 2)
Display("Maximum GC generations: " + GC.MaxGeneration);

// Create a new BaseObj in the heap
GenObj obj = new GenObj("Generation");

// Since this object is newly created, it should be in generation 0
obj.DisplayGeneration(); // Displays 0

// Performing a garbage collection promotes the object's generation
GC.Collect();
obj.DisplayGeneration(); // Displays 1

GC.Collect();
obj.DisplayGeneration(); // Displays 2

GC.Collect();
obj.DisplayGeneration(); // Displays 2 (max generation)

obj = null; // Destroy the strong reference to this object

GC.Collect(0); // Collect objects in generation 0
GC.WaitForPendingFinalizers(); // We should see nothing

GC.Collect(1); // Collect objects in generation 1
GC.WaitForPendingFinalizers(); // We should see nothing

GC.Collect(2); // Same as Collect()
GC.WaitForPendingFinalizers(); // Now, we should see the Finalize
// method run

Display(-1, "Demo stop: Understanding Generations.", 0);
}
class GenObj{
public void DisplayGeneration(){
Console.WriteLine(“my generation is ” + GC.GetGeneration(this));
}

~GenObj(){
Console.WriteLine(“My Finalize method called”);
}
}
垃圾回收机制的多线程性能优化
In the previous part, I explained the GC algorithm and optimization, and then the premise of the discussion was in a single-threaded situation. In a real program, it is likely that multiple threads work together, and multiple threads manipulate objects on the managed heap together. When a thread triggers garbage collection, all other threads should suspend access to any referenced objects (including objects referenced on their own stack), because the garbage collector may move the object and modify the object's memory address.
So when the garbage collector starts recycling, all threads executing managed code must be suspended. The runtime has several different mechanisms for safely suspending threads to perform garbage collection. I am not going to elaborate on the internal mechanism of this piece. However, Microsoft will continue to modify the garbage collection mechanism to reduce the performance loss caused by garbage collection.
The following paragraphs describe how the garbage collector works in a multi-threaded situation:
Completely interrupt code execution When garbage collection begins to execute, suspend all application threads. The garbage collector then records the thread's suspended position into a table generated by the just-in-time (JIT) compiler. The garbage collector is responsible for recording the thread's suspended position in the table and recording the objects currently being accessed. And the location where the object is stored (in variables, CPU registers, etc.)
Hijacking: The garbage collector can modify the thread's stack to make the return address point to a special method. When the currently executed method returns, this special method Will execute and suspend the thread. This way of changing the execution path of the thread is called hijacking the thread. When the garbage collection is completed, the thread will return to the previously executed method.
Safety point: When the JIT compiler compiles a method, you can insert a piece of code at a certain point to determine whether the GC hangs. If so, the thread hangs waiting for garbage collection to complete, and then the thread restarts execution. The places where the JIT compiler inserts checking GC code are called "safe points"
Please note that thread hijacking allows threads that are executing unmanaged code to execute during the garbage collection process. This is not a problem if unmanaged code does not access objects on the managed heap. If this thread is currently executing unmanaged code and then returns to executing managed code, the thread will be hijacked and will not continue execution until the garbage collection is completed.
In addition to the centralized mechanism I just mentioned, the garbage collector has other improvements to enhance object memory allocation and recycling in multi-threaded programs.
Synchronization-free Allocations: In a multi-threaded system, the Generation 0 heap is divided into several areas, and one thread uses one area. This allows multiple threads to allocate objects simultaneously without requiring one thread to own the heap exclusively.
Scalable Collections: Run the server version of the execution engine (MXSorSvr.dll) in a multi-threaded system. The managed heap will be divided into several different areas, one for each CPU. When recycling is initialized, each CPU executes a recycling thread, and each thread reclaims its own area. The workstation version of the execution engine (MXCorWks.dll) does not support this feature.
Large Object Recycling
This section will not be translated. There is a special article talking about it.
Monitoring Garbage Collection
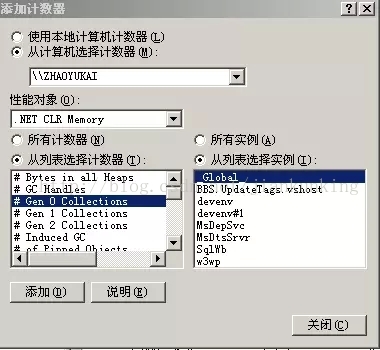
If you install the .Net framework, your There will be an item of .Net CLR Memory in the performance counter (Start Menu-Administrative Tools-Performance Enter). You can select a program from the instance list to observe, as shown in the figure below.

The specific meanings of these performance indicators are as follows:
Performance Counters |
Description |
# Bytes in all Heaps |
Displays the sum of the following counter values: "Level 0 Heap Size" counter, "Level 1" Heap Size counter, Level 2 Heap Size counter, and Large Object Heap Size counter. This counter indicates the current memory allocated on the garbage collected heap, in bytes. |
# GC Handles (number of GC processes) |
Displays the garbage collection in use The current number of processes. Garbage collection is the processing of resources outside the common language runtime and hosting environment. |
# Gen 0 Collections (number of level 2 collections) |
Display from application The number of times level 0 objects (that is, the youngest, most recently allocated objects) have been garbage collected since the program started. Level 0 garbage collection occurs when there is insufficient memory available in level 0 to satisfy an allocation request. This counter is incremented at the end of level 0 garbage collection. Higher-level garbage collection includes all lower-level garbage collections. This counter is explicitly incremented when a higher-level (level 1 or level 2) garbage collection occurs. This counter displays the most recent observed value. _Global_ The counter value is inaccurate and should be ignored. |
# Gen 1 Collections (number of level 2 collections) |
Display from application The number of times level 1 objects are garbage collected after the program starts. This counter is incremented at the end of level 1 garbage collection. Higher-level garbage collection includes all lower-level garbage collections. This counter is explicitly incremented when higher-level (level 2) garbage collection occurs. This counter displays the most recent observed value. _Global_ The counter value is inaccurate and should be ignored. |
# Gen 2 Collections |
Display from application The number of times level 2 objects are garbage collected since the program started. This counter is incremented at the end of a level 2 garbage collection (also called a full garbage collection). This counter displays the most recent observed value. _Global_ The counter value is inaccurate and should be ignored. |
# Induced GC (the number of GCs caused) |
Displays the GC caused by The peak number of garbage collections performed due to explicit calls to .Collect. It is practical to let the garbage collector fine-tune the frequency of its collections. |
# of Pinned Objects |
Displays the last garbage collection The number of pinned objects encountered. Pinned objects are objects that the garbage collector cannot move into memory. This counter only tracks pinned objects in the heap that are being garbage collected. For example, a level 0 garbage collection causes only pinned objects in the level 0 heap to be enumerated. |
# of Sink Blocks in use |
Display the current number of sync blocks in use. A synchronization block is an object-based data structure allocated for storing synchronization information. Synchronized blocks hold weak references to managed objects and must be scanned by the garbage collector. Sync blocks are not limited to storing only synchronization information; they can also store COM interop metadata. This counter indicates performance issues related to overuse of synchronization primitives. |
# Total committed Bytes |
Display garbage collection The amount of virtual memory currently committed by the server (in bytes). Committed memory is the physical memory of the space reserved in the disk paging file. |
# Total reserved Bytes |
Display garbage collection The amount of virtual memory currently reserved by the server (in bytes). Reserved memory is virtual memory space reserved for applications (but which has not yet used any disk or main memory pages). |
% Time in GC (percentage of time in GC) |
Displays the time since the last garbage collection The percentage of runtime spent performing garbage collection after the cycle. This counter typically indicates the work performed by the garbage collector on behalf of the application to collect and compact memory. This counter is only updated at the end of each garbage collection. This counter is not an average; its value reflects the most recent observations. |
Allocated Bytes/second (number of bytes allocated per second) |
Display The number of bytes allocated on the garbage collected heap per second. This counter is updated at the end of each garbage collection, not at each allocation. This counter is not an average over time; it displays the difference between the values observed in the two most recent samples divided by the time between samples. |
Finalization Survivors (the number of objects remaining when completed) |
Displayed because it is waiting for completion The number of objects retained for garbage collection after collection. If these objects retain references to other objects, those objects are retained, but they are not counted by this counter. The Completion Memory Promoted from Level 0 and Completion Memory Promoted from Level 1 counters represent all memory retained due to completion. This counter is not a cumulative counter; it is updated at the end of each garbage collection by the count of objects that survived only during that specific collection. This counter indicates that there may be excessive system overhead due to completing the application. |
Gen 0 heap size (Level 2 heap size) |
Displays the maximum number of bytes that can be allocated in level 0; it does not indicate the current number of bytes allocated in level 0. Level 0 garbage collection occurs when allocations since the most recent collection exceed this size. Level 0 size is fine-tuned by the garbage collector and can change during application execution. At the end of level 0 collection, the size of the level 0 heap is 0 bytes. This counter shows the size, in bytes, of the allocation that invokes the next level 0 garbage collection. This counter is updated at the end of garbage collection (not at each allocation). |
Gen 0 Promoted Bytes/Sec (bytes promoted from level 1/sec) |
Displays the number of bytes per second from level 0 to level 1. Memory is promoted after being retained from garbage collection. This counter is an indicator of objects created per second that have been retained for a significant period of time. This counter displays the difference between the values observed in the last two samples divided by the sampling interval duration. |
Gen 1 heap size (Level 2 heap size) |
Display the 1st The current number of bytes in the level; this counter does not show the maximum size of level 1. Objects are not allocated directly in this generation; these objects are promoted from previous level 0 garbage collections. This counter is updated at the end of the garbage collection (not on each allocation). |
Gen 1 Promoted Bytes/Sec (bytes promoted from level 1/sec) |
Displays the number of bytes per second promoted from level 1 to level 2. Objects that are promoted simply because they are waiting for completion are not included in this counter. Memory is promoted after being retained from garbage collection. There will be no promotion from level 2 as it is the oldest level. This counter is an indicator of very long-lived objects created per second. This counter displays the difference between the values observed in the last two samples divided by the sampling interval duration. |
Gen 2 heap size (Level 2 heap size) |
Display the 2nd The current number of bytes in the level. Objects are not allocated directly in this generation; these objects were promoted from level 1 during a previous level 1 garbage collection. This counter is updated at the end of the garbage collection (not on each allocation). |
Large Object Heap size |
Display large object heap The current size of , in bytes. The garbage collector treats objects larger than 20 KB as large objects and allocates large objects directly in the special heap; they are not promoted through these levels. This counter is updated at the end of the garbage collection (not on each allocation). |
Promoted Finalization-Memory from Gen 0 |
Shows the number of bytes of memory promoted from level 0 to level 1 simply due to waiting for completion. This counter is not a cumulative counter; it displays the value observed at the end of the last garbage collection. |
Promoted Finalization-Memory from Gen 1 |
Shows the number of bytes of memory promoted from level 1 to level 2 simply because of waits for completion. This counter is not a cumulative counter; it displays the value observed at the end of the last garbage collection. If the last garbage collection was a level 0 collection, this counter is reset to 0. |
Promoted Memory from Gen 0 |
Displays the number of bytes of memory retained after garbage collection and promoted from level 0 to level 1. Excluded from this counter are objects that are only raised while waiting for completion. This counter is not a cumulative counter; it displays the value observed at the end of the last garbage collection. |
Promoted Memory from Gen 1 (memory promoted from Gen 1) |
Displays the number of bytes of memory retained after garbage collection and promoted from level 1 to level 2. Excluded from this counter are objects that are only raised while waiting for completion. This counter is not a cumulative counter; it displays the value observed at the end of the last garbage collection. If the last garbage collection was a level 0 collection, this counter is reset to 0. |
This table comes from MSDN
The above is the content of .Net garbage collection mechanism principle (2). For more related content, please pay attention to PHP Chinese Net (www.php.cn)!

