Home >Backend Development >Python Tutorial >Summary of using Python to draw charts
Summary of using Python to draw charts
- 高洛峰Original
- 2017-02-13 13:38:113159browse
This article mainly introduces a comprehensive summary of using Python to draw charts. The editor thinks it is quite good. Now I will share it with you and give it as a reference. Let’s follow the editor and take a look.
Before using Python to draw charts, we need to install two library files, numpy and matplotlib.
Numpy is an open source numerical computing extension for Python, which can be used to store and process large matrices and is more efficient than Python's own data structure; matplotlib is a Python image framework, using its graphic effects and drawing under MATLAB The graphics are similar.
Below I will introduce how to use Python to draw through some simple code.
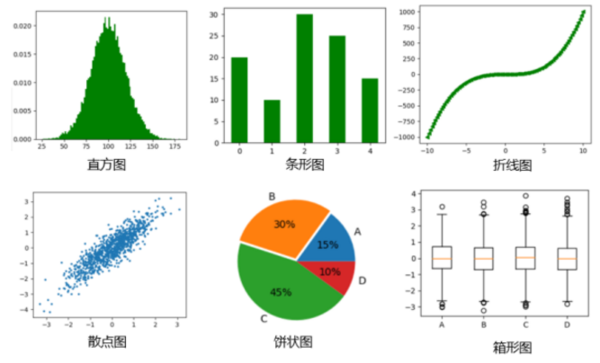
1. Graphic drawing

importmatplotlib.pyplotasplt

importnumpyasnp

mu=100

sigma=20

x=mu+sigma*np.random.randn(20000)# 样本数量

plt.hist(x,bins=100,color='green',normed=True)# bins显示有几个直方,normed是否对数据进行标准化

plt.show()
Bar chart
importmatplotlib.pyplotasplt

importnumpyasnp

y=[20,10,30,25,15]

index=np.arange(5)

plt.bar(left=index,height=y,color='green',width=0.5)

plt.show()
Line chart
importmatplotlib.pyplotasplt importnumpyasnp x=np.linspace(-10,10,100) y=x**3 plt.plot(x,y,linestyle='--',color='green',marker='<') plt.show()scatterplot
importmatplotlib.pyplotasplt importnumpyasnp x=np.random.randn(1000) y=x+np.random.randn(1000)*0.5 plt.scatter(x,y,s=5,marker='<')# s表示面积,marker表示图形 plt.show()pie chart
importmatplotlib.pyplotasplt

importnumpyasnp

labels='A','B','C','D'

fracs=[15,30,45,10]

plt.axes(aspect=1)#使x y轴比例相同

explode=[0,0.05,0,0]# 突出某一部分区域

plt.pie(x=fracs,labels=labels,autopct='%.0f%%',explode=explode)#autopct显示百分比

plt.show()
boxplot Mainly used to display the dispersion of data. The graph is divided into upper edge, upper quartile, median, lower quartile, and lower edge. The outside points are outliers
importmatplotlib.pyplotasplt

importnumpyasnp

np.random.seed(100)

data=np.random.normal(size=(1000,4),loc=0,scale=1)

labels=['A','B','C','D']

plt.boxplot(data,labels=labels)

plt.show()
2. Image adjustment
1. 23 point shapes"."point","pixel"o"circle"v"triangle_down "^"triangle_up"<"triangle_left">"triangle_right"1"tri_down "2"tri_up"3"tri_left"4"tri_right"8"octagon "s"square"p"pentagon"*"star"h"hexagon1"H"hexagon2 "+"plus"x"x"D"diamond"d"thin_diamond2. 8 built-in default color abbreviations
b:blueg:greenr:redc:cyan

m:magentay:yellowk:blackw:white
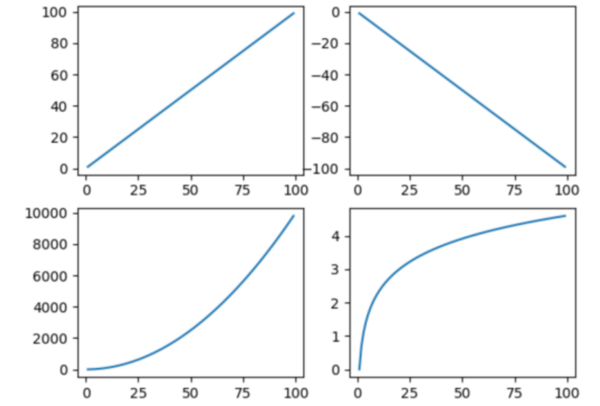
3. 4 types of linearity- solid line--dashed line-.dash line: dotted line4. Draw sub-pictures on one picture

importmatplotlib.pyplotasplt

importnumpyasnp

x=np.arange(1,100)

plt.subplot(221)#2行2列第1个图

plt.plot(x,x)

plt.subplot(222)

plt.plot(x,-x)

plt.subplot(223)

plt.plot(x,x*x)

plt.subplot(224)

plt.plot(x,np.log(x))

plt.show()
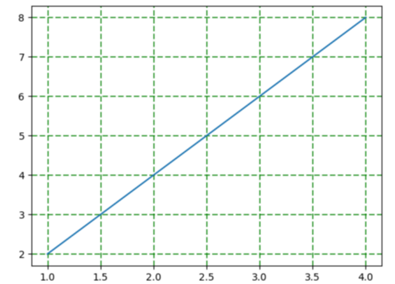
5. Generate grid

importmatplotlib.pyplotasplt

importnumpyasnp

y=np.arange(1,5)

plt.plot(y,y*2)

plt.grid(True,color='g',linestyle='--',linewidth='1')

plt.show()
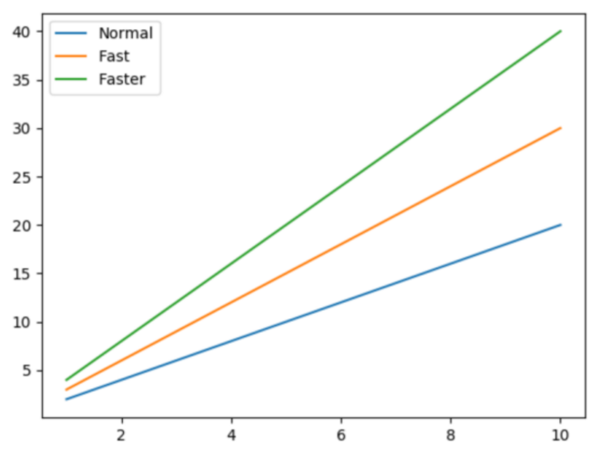
6. Generate legend

importmatplotlib.pyplotasplt

importnumpyasnp

x=np.arange(1,11,1)

plt.plot(x,x*2)

plt.plot(x,x*3)

plt.plot(x,x*4)

plt.legend(['Normal','Fast','Faster'])

plt.show()
The above is the entire content of this article, I hope it will be helpful to everyone’s study , I also hope that everyone will support the PHP Chinese website. For more articles related to the summary of drawing charts using Python, please pay attention to the PHP Chinese website!

