






查看 javascript 运行时 storage 耗时,最直接的方法是在 chrome devtools 的 performance 面板中录制性能分析,并观察 main 线程下的 scripting 与 rendering 任务,其中涉及磁盘 i/o 的操作(如 indexeddb 或 localstorage)通常会在调用栈中显示为阻塞主线程的同步操作或异步回调。要精确定位具体耗时,需结合代码中的关键存储调用点,使用 performance.now() 进行手动计时,或在 devtools 的 memory 面板中检查是否有因频繁读写导致的内存压力。

如何在 Performance 面板中识别 Storage 相关的阻塞
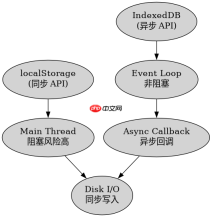
在 Performance 面板中,Storage 操作若发生在主线程且为同步 API(如 localStorage.getItem),会直接表现为 Scripting 片段中的长任务;若是异步 API(如 IndexedDB),则会在 Events 区域显示对应的 IDBRequest 事件及其回调执行时间。通过展开调用栈,可以找到具体的函数名和行号,从而定位到触发存储读写的代码位置。
const start = performance.now();
try {
  localStorage.setItem('key', JSON.stringify({ data: 'test' }));
} catch (e) {
  console.error(e);
}
const end = performance.now();
console.log(`Storage write took ${end - start} ms`);
如何对比不同存储 API 的性能差异
对比 localStorage 与 IndexedDB 的性能,关键在于数据量级和访问模式。localStorage 是同步且容量有限(通常 5MB),适合小数据;IndexedDB 是异步且容量大,适合大数据集。在 Performance 面板中,localStorage 的耗时通常集中在主线程的脚本执行阶段,而 IndexedDB 的耗时可能分布在多个事件循环中,包括数据库打开、事务创建和请求完成等阶段。

使用Atmosphere构建通过WebSocket、SSE、gRPC、WebTransport、MCP、A2A和AG-UI流传输的JVM代理网关,并带有治理钩子。

async function benchmarkIndexedDB() {
  const db = await openDB('TestDB', 1, { upgrade(db) { db.createObjectStore('store'); } });
  const start = performance.now();
  await db.put('store', 'key', { value: 'data' });
  const result = await db.get('store', 'key');
  const end = performance.now();
  console.log(`IndexedDB operation took ${end - start} ms`, result);
}
基于 localStorage 写入大量数据时的具体耗时问题
当使用 localStorage 写入大量数据时,每次写入都会触发序列化/反序列化以及可能的磁盘同步,导致明显的 UI 卡顿。例如,写入一个 1MB 的 JSON 字符串,耗时可能在几十毫秒到几百毫秒不等,具体取决于设备性能和当前系统负载。这种阻塞会直接影响用户交互,因此在处理大数据时应避免在主线程直接使用 localStorage,可考虑使用 Web Workers 或切换到 IndexedDB。
Java免费学习笔记:立即使用
解锁 Java 大师之旅:从入门到精通的终极指南