linux daily management
- 高洛峰Original
- 2016-12-02 16:01:071509browse
Monitor system status
w View the current system load (overall load)

The first line from left to right: time, system running time, number of logged in users, average load (number of cpu active processes per unit time (value The larger the server, the greater the pressure, as long as it does not exceed the number of CPUs))
(average system load value within 1 minute, average system load value within 5 minutes, average system load value within 15 minutes)
Second line: current Log in user, login point,
2. View cpu cat /proc/cpuinfo
3. Monitor system status vmstat (pressure at specific location) procs, memory, swap, io, system, cpu.

r b si so bi bo (focus)
proces: Process related information
r: Indicates the number of processes running and waiting for CPU time slices. If it is greater than the number of server CPUs for a long time, it means that the CPU is not enough;
b: Indicates The number of processes waiting for resources, such as waiting for I/O, memory, etc. If the value of this column is greater than 1 for a long time, you need to pay attention;
memory: memory-related information
swap: indicates switching to the memory in the swap partition Quantity
free: the current amount of free memory;
buff: buffer size, (to be written to the disk);
cahe: cache size, (read from the disk);
swap: memory swap situation
si: The amount of data written from the swap area to the memory;
so: The amount of data written from the memory to the swap area;
io: Disk usage
bi: The amount of data read from the block device ( Read disk);
bo: The amount of data written from the block device (write to disk);
system: Display the number of interrupts that occurred during the acquisition interval
in: Represents each device observed in a certain time interval Number of interrupts;
cs: Indicates the number of context switches generated per second;
cpu displays the usage status of the CPU
id: Indicates the percentage of time the CPU is idle;
wa: Indicates I The percentage of CPU time occupied by /O waiting;
st: indicates the percentage of stolen CPU (usually 0, no need to pay attention);
When the disk IO pressure is high, the bi bo value is high
si, the so value is high , and keeps changing, indicating that there is insufficient memory
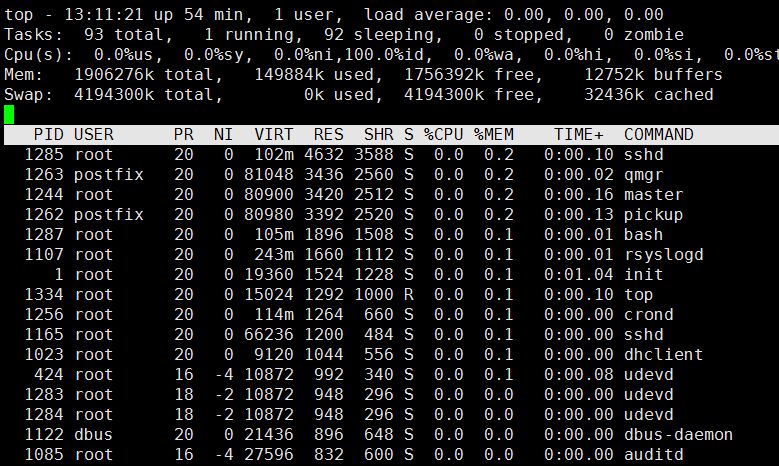
4.top Displays the system resources occupied by the process (dynamically monitors the system resources occupied by the process, changes every 3 seconds)

res: The memory size occupied by the process
%mem :Used memory ratio
shift+m Sort by memory usage
1 List CPU usage
top -bn1 Non-dynamic printing system resource usage Output all information at once instead of dynamic display.
5 sar monitors the status of all resources in the system (average load, network card traffic, disk status, memory usage). It can print historical information and display system status information from zero o'clock on the day to the current moment. yum install -y sysstat
1) sar -n DEV Check the network card traffic
2)sar -n DEV 1 5 Check the network card traffic in real time

IFACE device name
rxpck/s The number of packets received per second
txpck/s Packets sent out per second The amount of data
rxbyt/s The amount of data collected per second (Byte)
txbyt/s The amount of data sent per second
The server you manage has very serious packet loss. Check whether the network card traffic is abnormal, cleavage rxpck/ s>4000 or rxbyt/s>5000000 may be attacked (except copying data)
3) san -n DEV -F /var/log/sa/sa0
-f option to view the network card of a certain day Traffic history followed by file name
4) sar -q View historical load
6 free View memory usage
7 ps View system process
ps aux Display system process
pid id of process Terminate process kill -9 process pid
ps aux | grep -c mingetty View a process or its number. The resulting number needs to be reduced by 1 (grep itself is also one)
8 netstat Check the network status
netstat -lnp Print which ports the current system starts
netstat -an Print the network connection status
9 tcpdump Packet capture tool
tcp -nn -i eth0 -nn Let the third and fourth columns be displayed in the form of IP + port number. Without -nn, the host name + service name will be displayed

