Home >Web Front-end >HTML Tutorial >Use eclipse+fiddler+WeChat web developer tools to debug local WeChat pages
Use eclipse+fiddler+WeChat web developer tools to debug local WeChat pages
- WBOYWBOYWBOYWBOYWBOYWBOYWBOYWBOYWBOYWBOYWBOYWBOYWBOriginal
- 2016-10-22 00:00:171967browse
As mentioned before, debug the WeChat page on the server, put the link: http://www.cnblogs.com/Gabriel-Wei/p/5977850.html and the fiddler debugging link: http://www.cnblogs.com/ Gabriel-Wei/p/5961404.html
Today we will talk about using eclipse+fiddler+WeChat web developer tools to debug our local WeChat page.
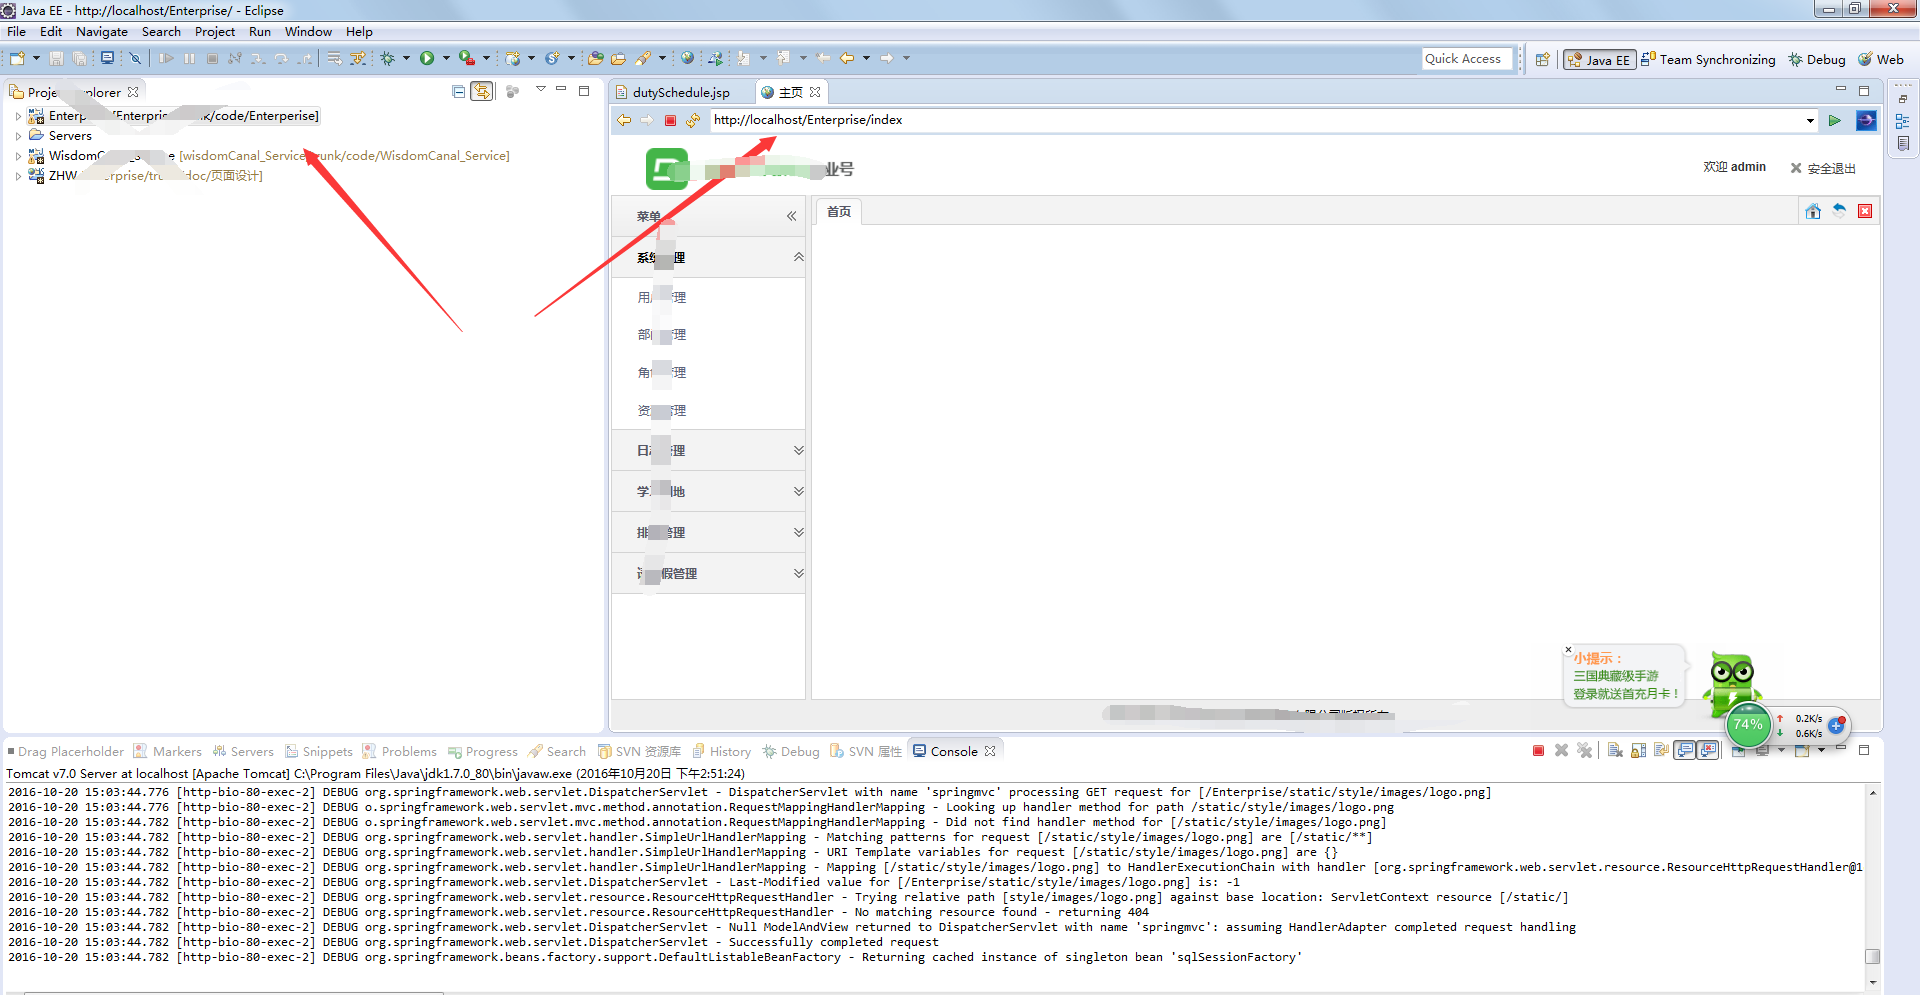
1. Mine is that the WeChat page and the background page are put together. The WeChat project must be run in eclipse, otherwise an error will be reported on the WeChat page on the mobile phone----》Because the target computer actively refuses to connect, the link cannot be made. 192.168......

2. Start our fiddler, the port is still 8888 (fiddler settings are mentioned in the previous article).
3. Connect the mobile phone to our computer with a data cable, and turn on the mobile phone developer options-USB debugging mode.
4. Set up mobile proxy. The mobile proxy address is the ip of our current computer: 192.168.1.36 (the setting method of the mobile proxy is also mentioned earlier), as shown in mine, the port number is Fiddler’s 8888 (remember it is not the WeChat debugging tool)

5. Modify our host file and point the URL we want to visit to our local machine.

5. Open the WeChat web debugging tool and enter the following page. Select the option marked by my arrow.

6. Click to start debugging. Now we can debug our locally stored WeChat page. Use our mobile phone to randomly click on a page in our WeChat enterprise account, and the following picture will appear. Click inspect to see our local debugging page. This method does not need to be submitted to the server, which is very easy to use.

7. Click inspect, as shown in the picture. The page on our mobile phone will be reflected in our debugging tool from time to time. Very cool.


