Some suggestions for Java performance tuning projects
- 高洛峰Original
- 2016-10-13 09:42:361544browse
In August 2016, at the APMCon 2016 China Application Performance Management Conference co-sponsored by Geeknet, InfoQ and Tingyun, Java performance tuning expert Monica Beckwith conducted the "Java Performance Tuning Must-Read Code" (original title: Java Performance Engineer's Survival Guide)'s speech. During the speech, Monica gave personal suggestions on Java tuning best practices: how to set the performance requirements that need to be tuned, what indicators need to be analyzed, and how to specifically carry out tuning after the goals are set.
Monica Beckwith focuses on the optimization of Java virtual machines and garbage collectors in enterprise applications, and has published many articles on garbage collectors and Java memory models. She previously worked at Oracle, leading the G1 garbage collector performance team, and is currently an independent consultant. After Monica's speech, InfoQ conducted an exclusive interview with her.
Preparation work before performance tuning
Monica believes that performance optimization project consists of two parts: performance requirement analysis and planning, and performance result analysis. The two form a closed loop, allowing performance to be continuously improved.
1. Performance requirements analysis and planning
When determining performance requirements, engineers must first ask themselves three questions:
What will make users happy?
What will make users annoyed?
Current problems Does it need to be paid attention to and solved?
Next, we need to think about QoS from the perspective of users; quantify QoS standards into measurable indicators, namely SLA service level agreement; then define, sort out and prioritize SLA performance indicators level (throughput, response time, capacity, request footprint, CPU usage, etc.).
1. Throughput/rate:
Target - Can it be lower than the set throughput? If so, how long can this state last? How low can it be as low as possible?
Measurement - How to measure? (Number of transactions/ seconds, number of messages/second or both) where to measure? (client, server or browser)
2. Response time:
Goal - Can the set response time be exceeded? If so, this How long can the state last? How long can it reach the longest?
Test - how to measure? (Calculate the average by taking 99% of the response time, only count a certain period of response time (5-9 seconds), the worst case or all) Where to measure ? (Client, server or the entire loop)
3. Capacity management:
What is the acceptable capacity? What if a system is overloaded (load balancing problem)? How to measure capacity? One system and all What is the maximum capacity that the system can withstand? How long can it withstand it? What indicators need to be monitored?
2. Performance result analysis
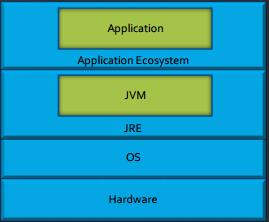
Regarding performance result analysis, only Java performance analysis will be discussed here. Analyze which factors will affect the end user experience and fail to achieve the expected QoS; track and monitor performance indicators. The following picture is a layered situation diagram:

Application layer ecosystem: application services, application servers, databases, other services in the ecosystem
JRE layer: class loading, JIT compilation, garbage collection, threads Situation
Operating system layer: system/kernel status, lock status, thread status
Hardware layer: memory bandwidth/memory throughput/memory usage, CPU/kernel usage, CPU cache efficiency/usage/level, processor structure, IO status
Execution of performance tuning
Two implementation modes
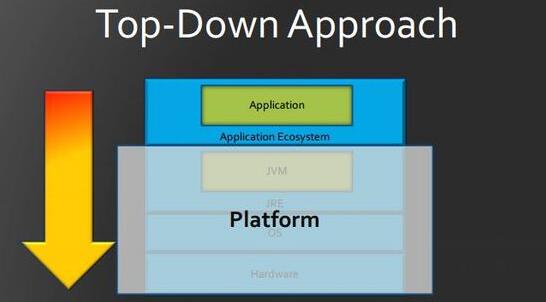
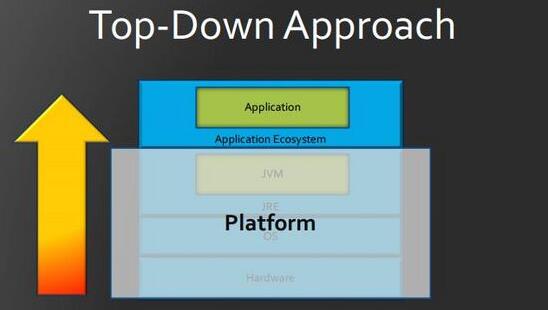
Monica proposes two implementation methods: top-down and bottom-up. Which one to use depends on what you want to achieve.
If you want to make improvements from the application level, and you are an application engineer with the ability to modify code, you can use a top-down approach.

If you want to make improvements from the platform level, you can use a bottom-up approach. First, you need to identify which module of the platform needs improvement; secondly, list the relevant applications and evaluate the workload; and then find the appropriate tools.

Four steps
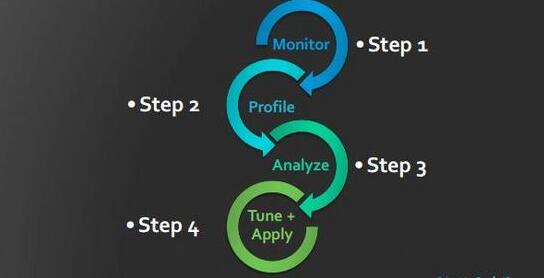
No matter which direction, it can be divided into four steps: the first step is monitoring, the second step is induction, the third step is analysis, and the fourth step is optimization and application.

Generally speaking, the following indicators are of concern.
CPU: CPU status, kernel status, number of cache hits and misses, branch prediction, pipeline, conditional transfer, load-store working mode, etc.
Memory: memory usage, memory, bandwidth, read and write status, read operations The maximum bandwidth, the maximum bandwidth of write operations, the maximum capacity, are related to the structure.
JVM/GC: Collect information related to changes, collect information about various stages of general or concurrent GC, concurrent work queues and work status, internal queues or caches, etc.
1. Monitoring
The first step is to start with the monitoring process.
Monitoring methods are divided into three types: active (alarm setting), passive (network splitter), and offline (log capture).
There are three types of tools you can choose:
Third party - VisualVM, Java Flight Recorder
JVM comes with commands - PrintCompilation, PrintGCDetails (+PrintGCDateStamps), jmap-clstats, jcmd GC.class-stats
Operating system comes with - mpstat, sysstat under Linux – iostat, pidstat, prstat, vmstat, dash, CPU-Z, cacti, etc.; under Windows there are Performance Monitor, Task Manager, Resource Monitor, CPU-Z, cacti, etc.
2. Summary and analysis
The next step is the summary and analysis link.
At this point you already have all the information you need. You need to identify areas that need improvement and analyze potential issues that need improvement. There are two types of open source tools that can be used in this link:
Third-party performance analysis tools - Oracle Solaris Studio Performance Analyzer, perftools, PAPI, Code XL, Dtrace, Oprofile, gprof, LTT
Java program level - Visual VM, Netbeans Profiler, JConsole
3, Tuning
The last step is tuning. The focus of JVM/GC tuning is to choose the right heap and the right garbage collection algorithm. First, correctly divide the age of the object, and then only tune long-term surviving objects. All GC worker threads of each virtual machine (GC's stop-the-world phenomenon), and multiple GC threads in the same VM are executed; See if compressing plain object pointers works; large heaps may require enabling AlwaysPretouch and setting UseLargePages to the optimal size. In addition, optimize at the code level to meet SLA goals, set appropriate ramp-up and ramp-down, object age division and retention policy (understand the formation of LDS files), and ensure correct measurement.
Talk to Monica
InfoQ: Is it necessary to collect all logs during performance analysis?
Monica: When we know that something needs to be tuned, generally speaking, users will send me logs from the production environment. , we replicate the environment based on this, and then test and inspect in this replicated environment. I don't recommend testing in a real environment because the production environment needs to be stable. Under what circumstances are all logs needed? When we are sure that a certain problem exists, such as a memory leak, we need to collect all logs as much as possible at this time.
InfoQ: Can you analyze several GC methods and make a simple evaluation?
Monica: Garbage collection is the core of Java application tuning. GC not only collects garbage information, but also manages heap allocation information; all allocations are similar. Generally speaking, if you have a small space to divide objects into generations; in hotspot JVM I recommend optimizing on old generation objects. Because the young generation makes up the majority and will die. The common default among old generation collection algorithms is the garbage mark-compression algorithm.
CMS garbage collector targets the recycling of the old generation, marking surviving objects starting from the root object. Once there are no longer alive objects in the space, the occupied resources will be released and updated to the free list; what CMS does is to divide all the old generation that should belong to the free list into it.
Another design is G1. It divides resources into regions. Some regions together constitute the young generation, and some constitute the old generation. That is, all regions in the same generation are not necessarily adjacent. Each region is initially arbitrary and needs to be declared as young or old generation. During the collection period, the old generation does not necessarily all participate. G1 cares about collecting areas with a lot of garbage. In addition, G1 will also try to adjust the interval size of the young generation.
InfoQ: What is the thing you most want to change in Java right now?
Monica: Java's non-heap memory management may be improved in JDK 9 or JDK 10; also detecting memory leaks is difficult, I think there is a lot that needs to be improved The place.
InfoQ: In order to achieve better performance, what do you think Java software development engineers need to pay attention to?
Monica: When programming, you must think about how the Java GC works. It is not expired objects that occupy resources, but living objects; living objects need to be maintained. When programming, you need to understand object creation, retention strategies, and how the garbage collector works. It’s good to take these three points into consideration. You don’t have to force yourself to do everything right, as long as the whole thing is coordinated and well-coordinated, that’s good.

