
PHP debugging tool -- xdebug

- WBOYWBOYWBOYWBOYWBOYWBOYWBOYWBOYWBOYWBOYWBOYWBOYWBOriginal
- 2016-08-08 08:49:481384browse
Previously organized in Evernote, now moved out. Divided into local debugging and remote debugging. This article has been personally tested and taken with screenshots. If you have any questions, please leave a message to discuss.
(Referring to the blogs of many seniors on the Internet, I forgot to save the original link in my notes. I cannot post the link here. I hope you will forgive me)
# Sore spot
Generally, functions such as echo and var_dump() are used to debug PHP projects. If the project is large, it is very inconvenient and inefficient;
# Prepare
Install xdebug extension;
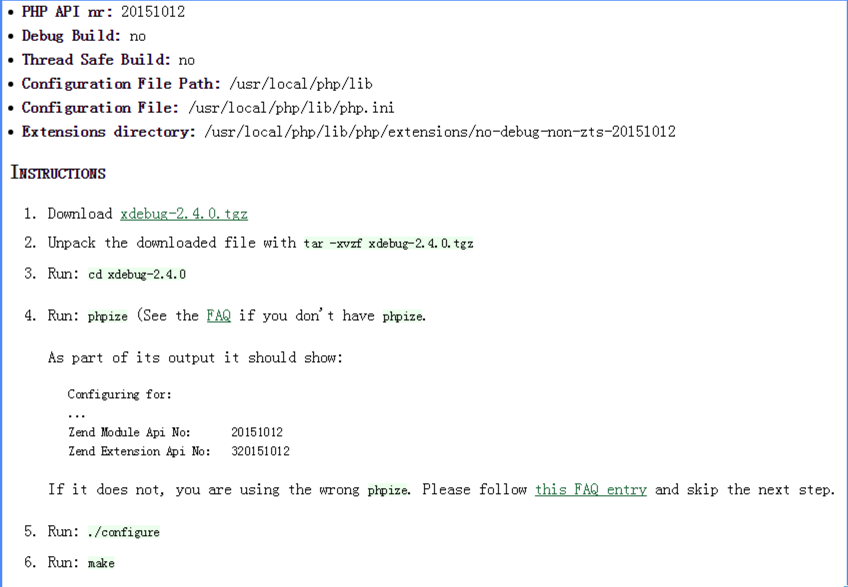
Official website https://xdebug.org/download.php
For Windows, just find the corresponding version and download it. For Linux, put the output result of php -i on the page https://xdebug.org/wizard.php and it will tell you how to do it. It is very convenient; as follows:
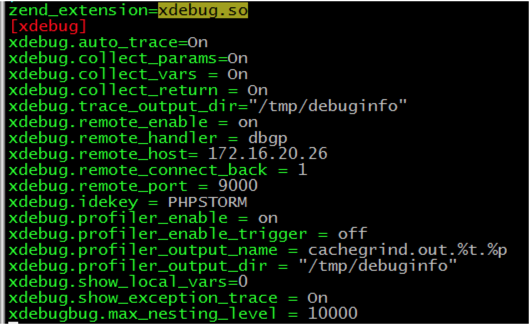
1. Modify the php configuration file and add it at the end.
zend_extension = "E:/wamp/bin/php/php5.5.12/zend_ext/php_xdebug-2.2.5-5.5-vc11-x86_64.dll";
[xdebug]
xdebug.auto_trace=On
xdebug.collect_params=On
xdebug.collect_vars = On ;Collect variables
xdebug.collect_return = On ;Collect return value
xdebug.trace_output_dir="e:/wamp/tmp/debuginfo"
xdebug.remote_enable = on
xdebug.remote_handler = dbgp
xdebug.remote_host= localhost ; used for remote debugging server address
xdebug.remote_connect_back = 1; for remote debugging
xdebug.remote_port = 9000
xdebug.idekey = PHPSTORM
xdebug.profiler_enable = on
xdebug.profiler_enable_trigger = off
xdebug.profiler_output_name = cachegrind.out.%t.%p
xdebug.profiler_output_dir = "E:/wamp/tmp/debuginfo"
xdebug.show_local_vars=0
xdebug.show_exception_trace = On ; Turn on exception tracking
xdebugbug.max_nesting_level = 10000
Verify in phpinfo whether the xdebug extension is enabled. Server configuration completed!
2, phpstrom configuration
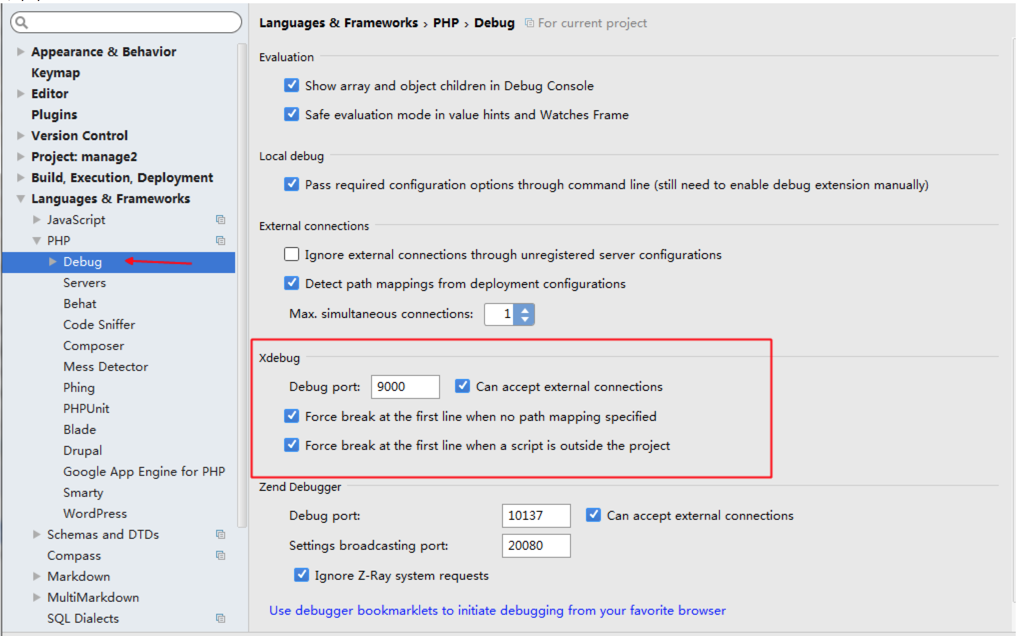
The port configured here means that the IDE will listen to port 9000 on this machine
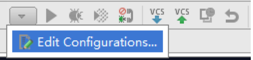
In the debug configuration in the upper right corner of the project
Select the type according to the project as follows, select web application for the website, and customize the Name item
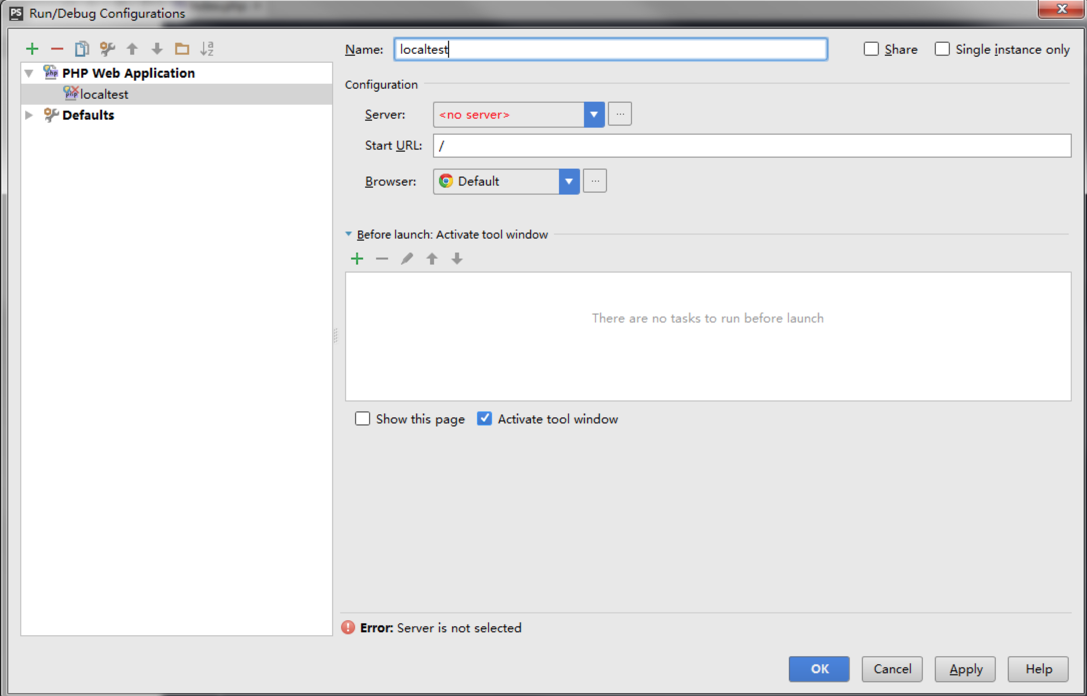
The server item is not available, click the button below to configure it
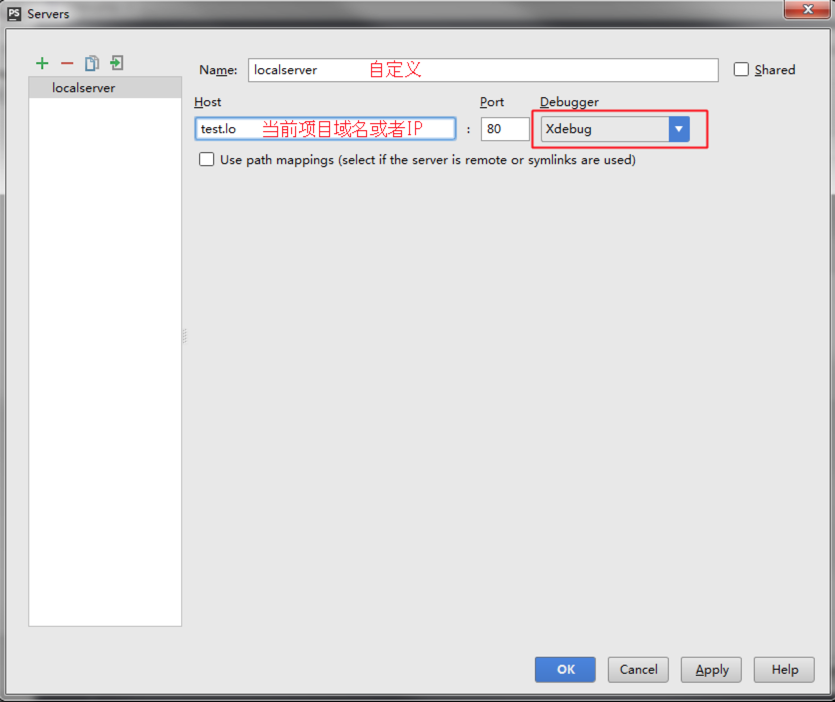
Configure starturl (entry address)
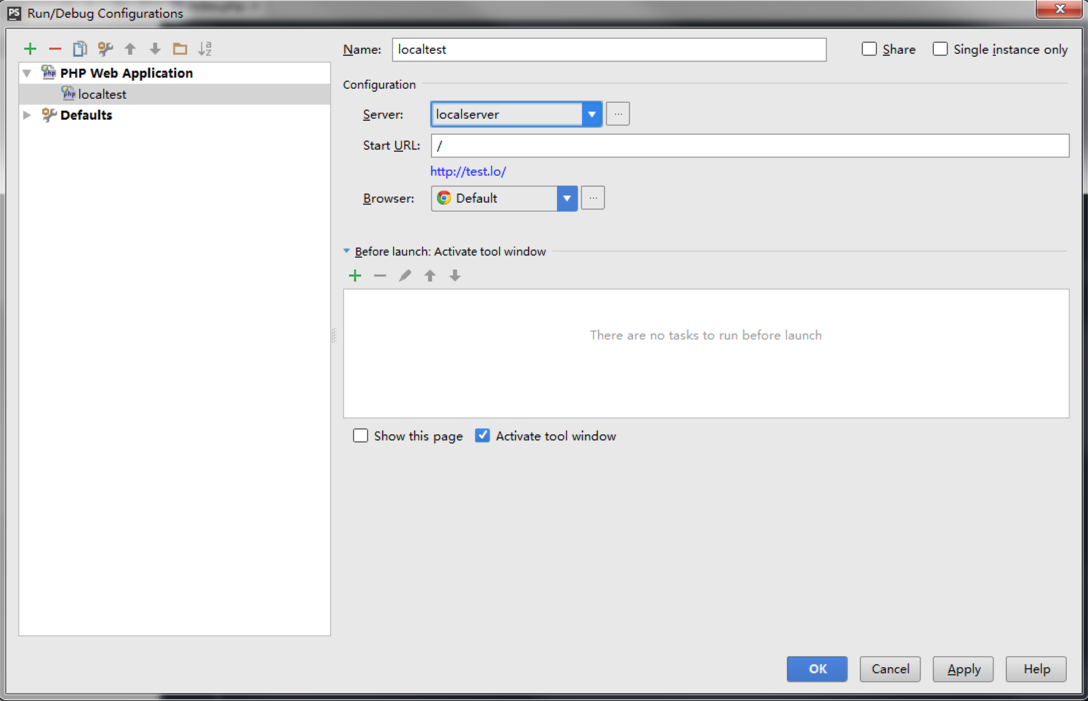
The completed configuration is as follows:
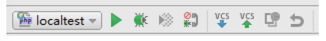
Click on the bug to enable debugging, and the starturl will be opened in the default browser we configured in the previous step, as follows:
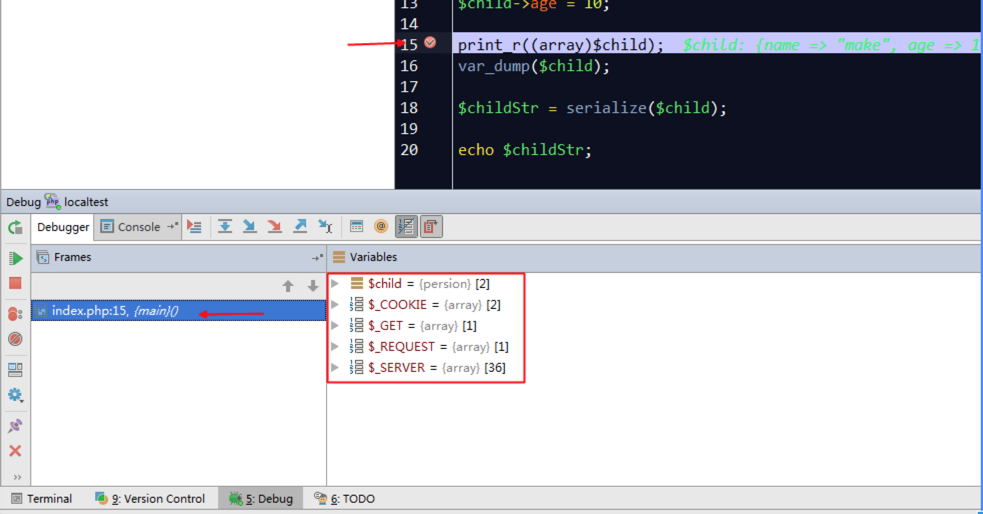
Put a breakpoint in the code, refresh the page, the debugging window will display detailed information, and there are operation buttons on it, as follows:
# Optimized place
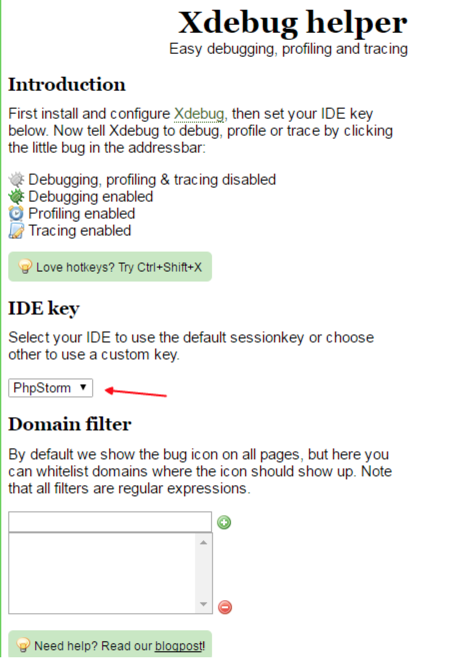
The above debugging steps are very troublesome. We all hope to debug when we want to debug. The recommended plug-in chrome plug-in xdebug helper is convenient for debugging at any time; it is also a bug icon. Configure it during installation, as follows:
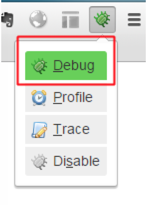
Enable the plug-in on the page that needs to be debugged
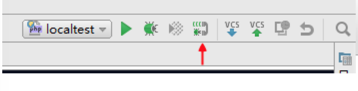
Light up the phone icon in the IDE and start monitoring, as follows:
After the configuration is completed, if you want to debug in the code, you can directly break the point. After the browser accesses the page, and runs to the breakpoint, the IDE will monitor the debug information and display the information;
#xdebug remote debugging
Some projects are difficult to set up an environment for local development. We need to develop and debug remotely. That is to debug the code on the remote development machine locally.
! 0. Remote debugging principle:
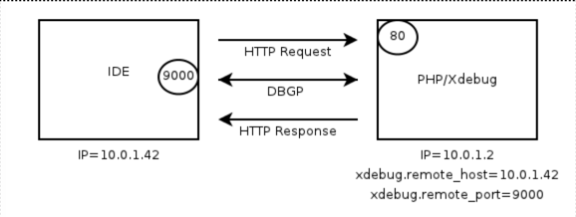
On the left is the debugging client, such as IDE such as IDEA and eclipse, and on the right is xdebug. Follow the following steps to run:
1. The IDE listens to a debugging port. The default is 9000 and can be configured by yourself.
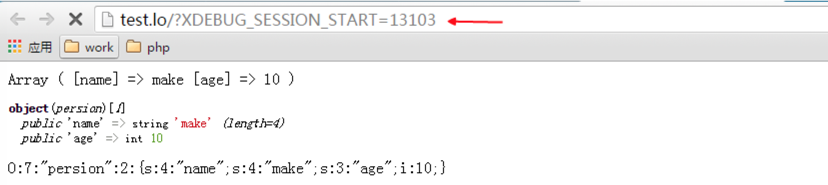
2. The user accesses the server in the php environment on the right. We use a browser to access it here (it can be done anywhere, choose a local browser for convenience). Generally, the IDE will automatically help us add
after the normal url.
XDEBUG_SESSION_START=a random number parameter. This parameter is used to notify xdebug to actively connect to the 9000 port of the IDE for debugging. Without this parameter, xdebug will not actively connect to the IDE,
The debugging will not be triggered.
3. xdebug takes the initiative to connect to the 9000 port of the IDE. After the connection is successful, debugging starts.
How does xdebug know that the IDE is listening on port 9000?
xdebug has two configurations: remote_host and remote_port, which represent the IDE's IP address and listening port respectively. It can be seen that the IDE and xdebug must negotiate the listening port.
The port is easy to handle, but if my IP changes, then if I change it, wouldn’t I need to modify the xdebug.remote_host configuration? So complicated! ! !
It doesn’t matter if you don’t know the IP.
Address, then use this ip address as remote_host to connect. 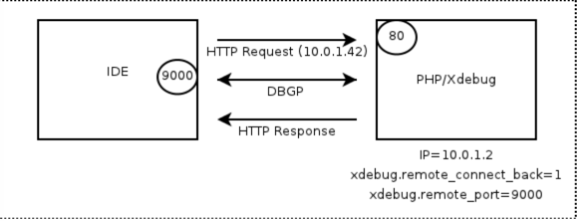

your local address, separate multiple ones with commas
xdebug.remote_connect_back should be set to 1 or on After setting this, the remote_host setting will be automatically ignored. If the local IP is automatically obtained or there are multiple people, it is better to turn this on
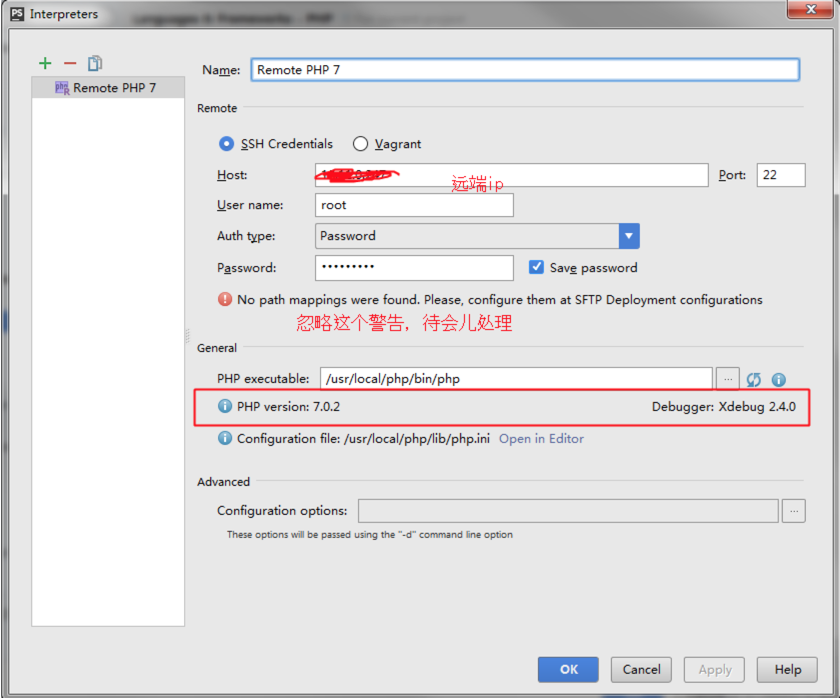
 The server configuration is complete!
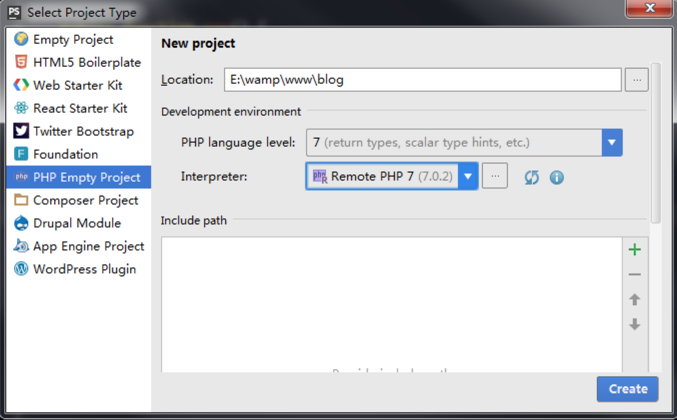
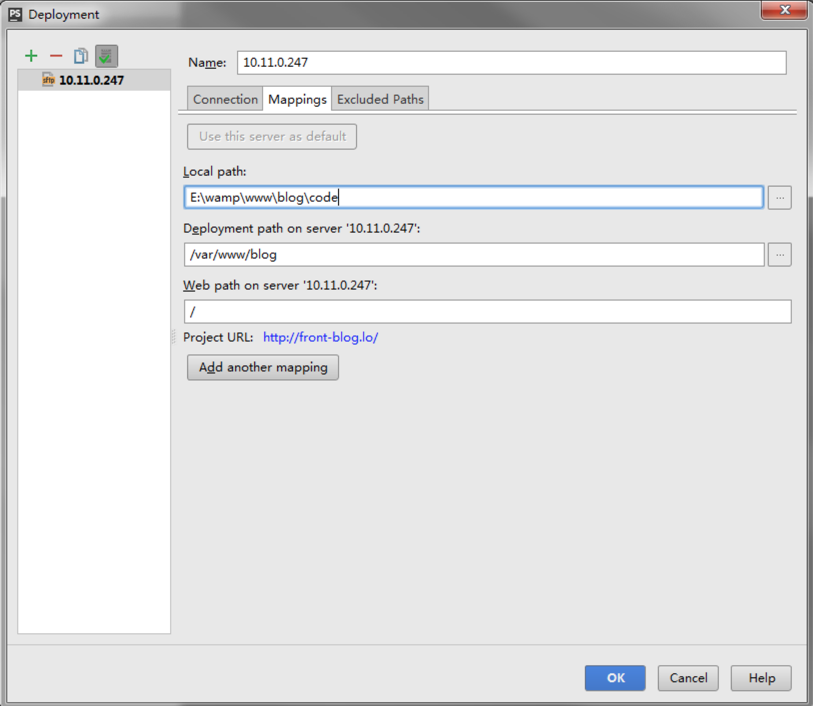
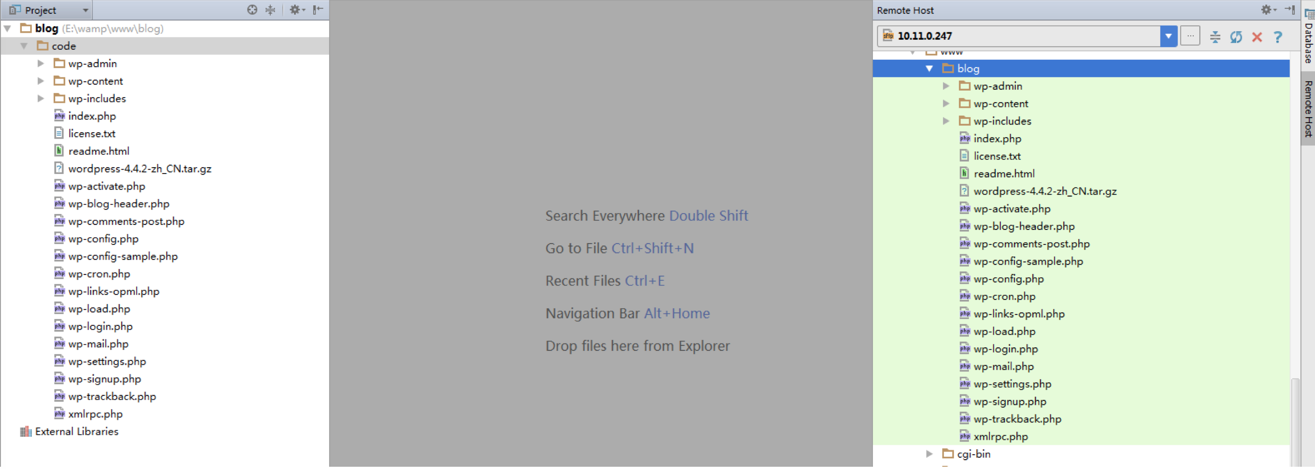
 > Create a new project or map an existing local project to a remote project
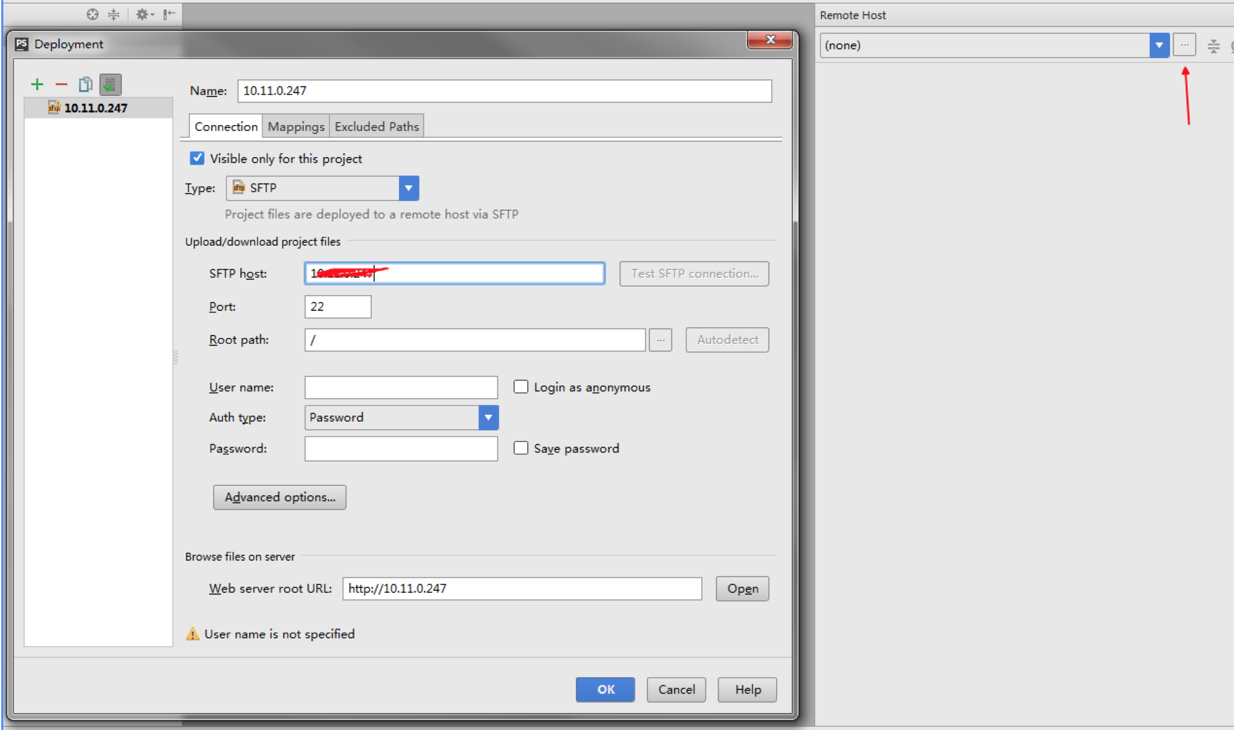
Configure mapping again
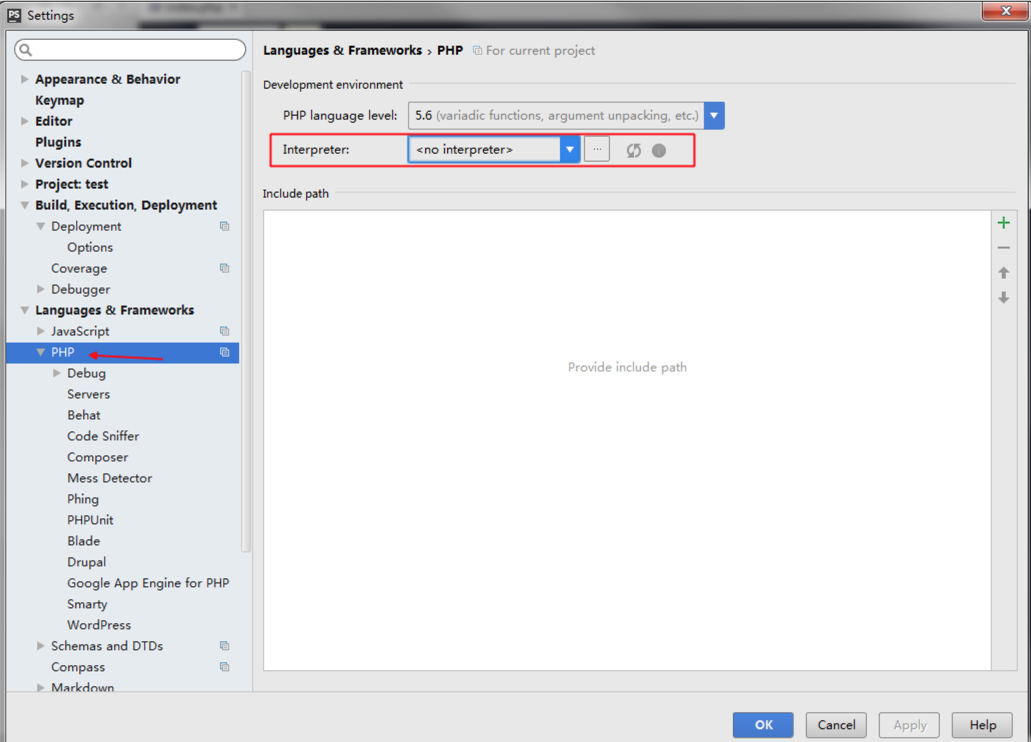
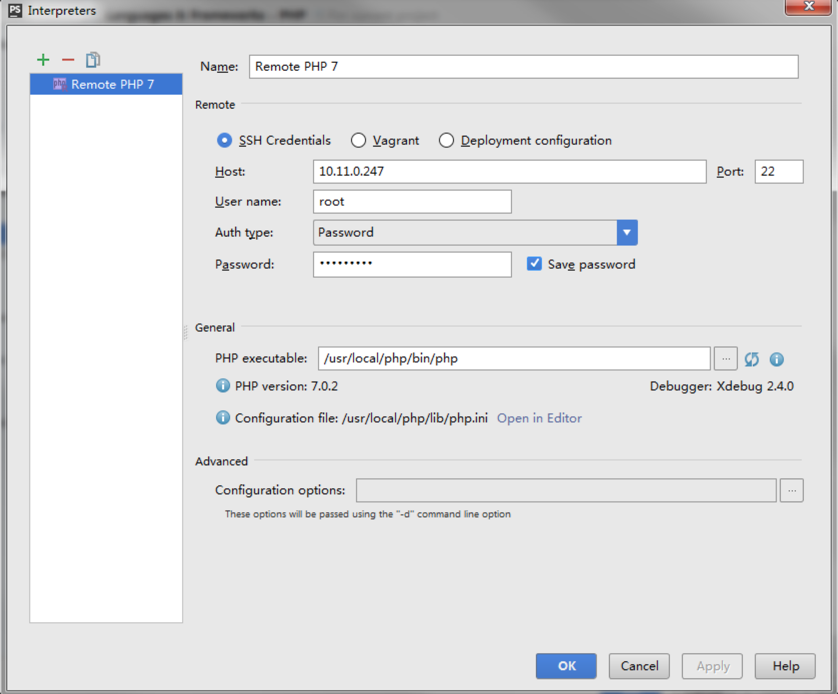
 At this time, look at the remote interpreter we started configuring. The previous warning is gone because we configured mapping
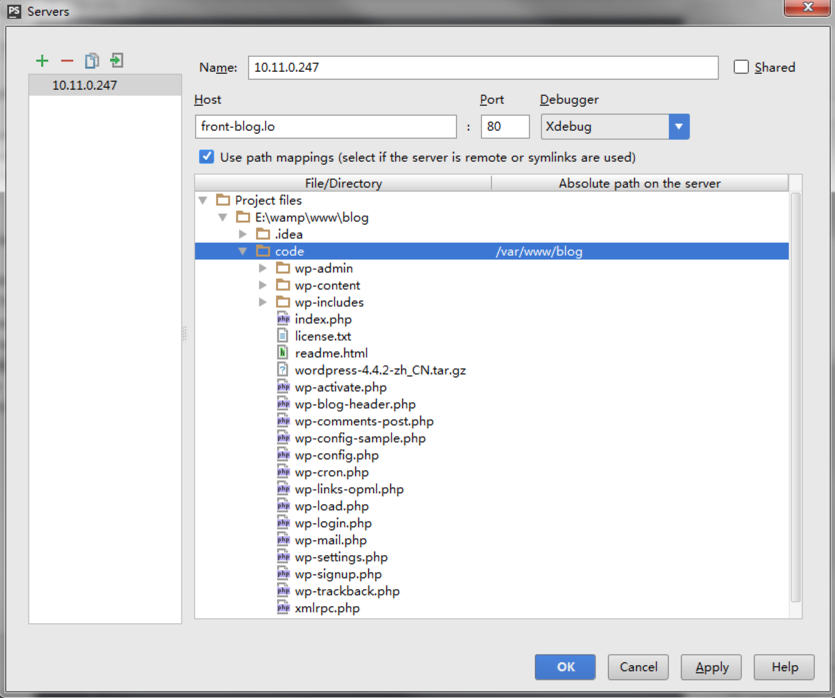
 Configuring debug, the steps are the same as above, the difference is configuring path mapping
Start debugging. Break point Browser accesses the remote address. The debug window already has debugging information
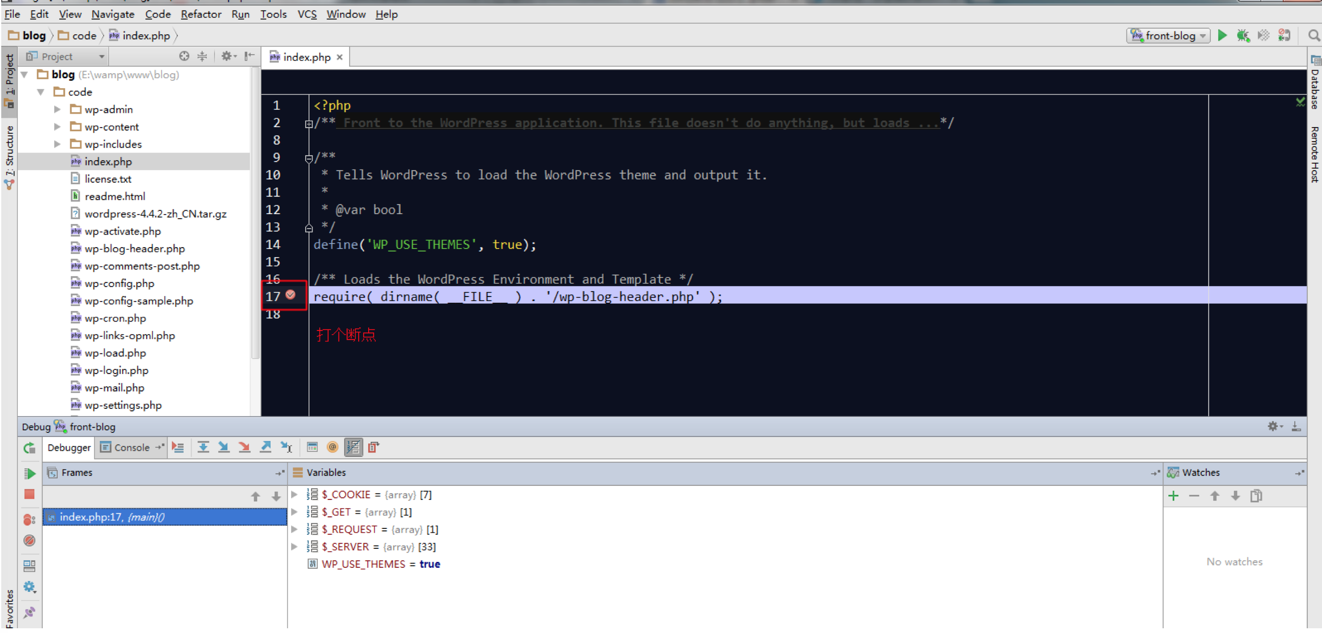

Ignore my 504. This is caused by other reasons and has nothing to do with xdebug, because it is a test project and I am too lazy to take care of it ~ ~
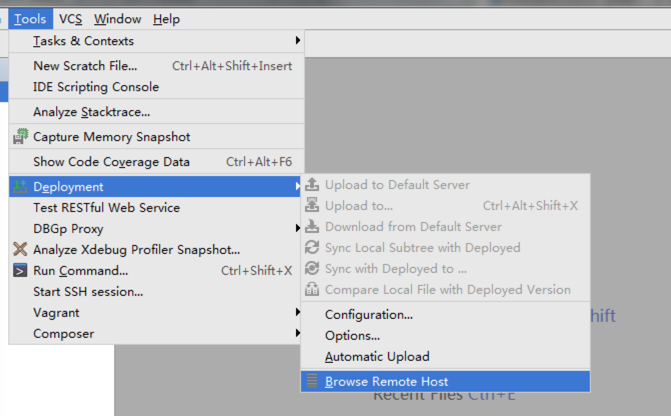
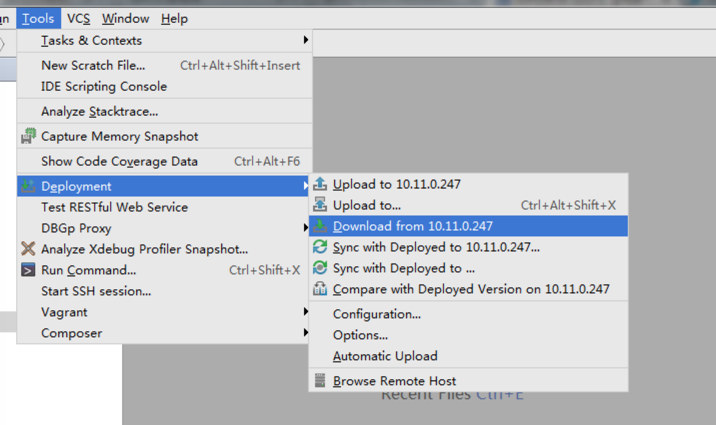
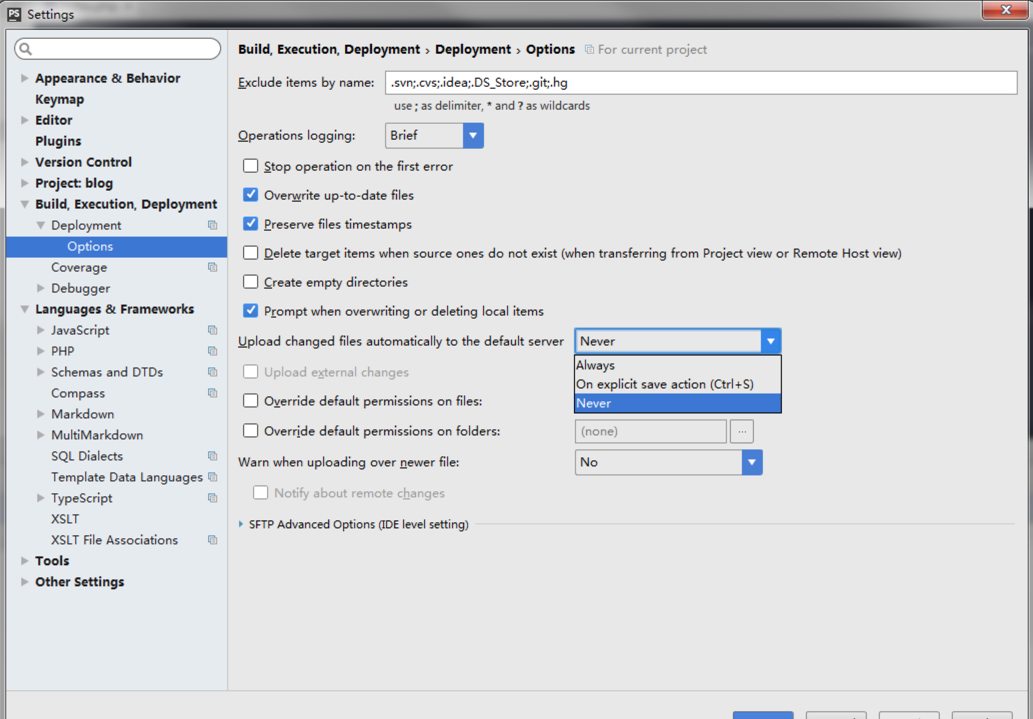
To develop remote projects, we have just configured sftp. Our local modifications can be automatically synchronized to the remote end through the following configuration. I usually choose the ctrl + s option. Pressing ctrl + s will automatically synchronize to the remote development machine
Statement:
The content of this article is voluntarily contributed by netizens, and the copyright belongs to the original author. This site does not assume corresponding legal responsibility. If you find any content suspected of plagiarism or infringement, please contact admin@php.cn
Previous article:Some applications of recursion (1) Traversing foldersNext article:Some applications of recursion (1) Traversing folders