|
Benchmark testing tools (ab)
What is ab? win: If there is an apache development environment locally, then ab is in the bin directory under the apache directory by default. You can see it by opening the bin directory Type the following code directly (note to switch the directory where ab is located)
Wait for ab to run it yourself and get the following results
Enter the following command to get the ab help document, which explains the usage and the meaning of command options respectively
ab帮助文档的输出
英文看不懂,附上中文解释,网上抄的,我没试过
Generally use -n, -c, -t -t. The following means 10 concurrent visits in 20 seconds
Code complexity Browser parsing Web server configuration Geolocation and network issuesIf the web server is stored overseas, then we access the overseas website locally. As you can imagine, we pass through the router nodes, server nodes, and then through the optical cable under the Pacific Ocean, and then access the web server. After processing by the web server , continue with the submarine optical cable, and jump back to each server and routing node. This will definitely affect the test results (my suggestion is to conduct ab testing directly on the server) Response file sizeIf a 3MB page is sent, the server network card will split the 3MB data into a single small data packet. During the transmission process, if only one data packet is damaged or lost, all data packets will be resent, so the sent packet The smaller the better, and at the same time, the smaller the data transfer, the faster it is transferred to the user's machine. code complexityThe complexity of the code means complex processing of business logic, as well as file calls, database access, remote API interface calls, etc., which will affect the processing time Browser parsingEach browser has its own way of processing js, css, and html. Just think about the difference between IE8 and below and chrome Web server settingsAfter the general Web server is installed, simple settings can be used to implement Web services (out of the box). However, such settings do not maximize the performance of the Web server. Senior engineers are required to configure the server to maximize performance. Here are simple and practical Keep-Alive instructions. The function of Keep-Alive is that the web server opens a specific number of connections and keeps these connections open so that it can quickly process incoming requests, so that it does not open a connection for each incoming request and then process the request. , Reduce the number of processes on the server that process requests, thereby increasing the number of concurrencies.Use -k in ab for testing, such as the following sentence
Copy code
Testing tools
|
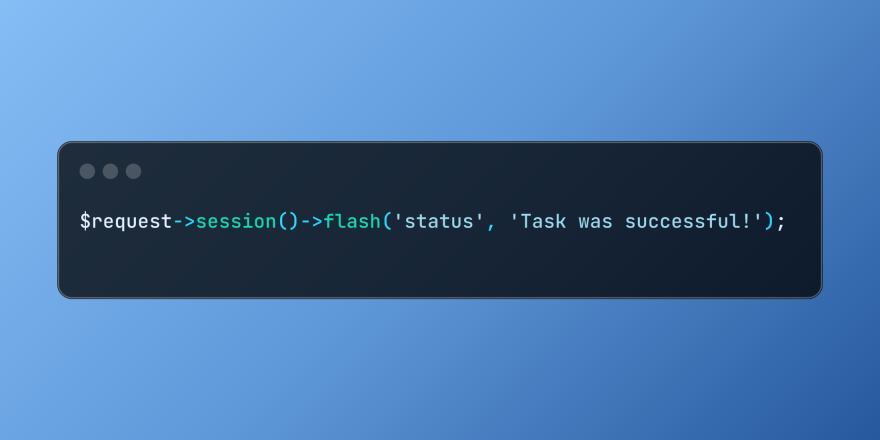
 Working with Flash Session Data in LaravelMar 12, 2025 pm 05:08 PM
Laravel simplifies handling temporary session data using its intuitive flash methods. This is perfect for displaying brief messages, alerts, or notifications within your application. Data persists only for the subsequent request by default: $request-
 cURL in PHP: How to Use the PHP cURL Extension in REST APIsMar 14, 2025 am 11:42 AM
The PHP Client URL (cURL) extension is a powerful tool for developers, enabling seamless interaction with remote servers and REST APIs. By leveraging libcurl, a well-respected multi-protocol file transfer library, PHP cURL facilitates efficient execution of various network protocols, including HTTP, HTTPS, and FTP. This extension offers granular control over HTTP requests, supports multiple concurrent operations, and provides built-in security features.
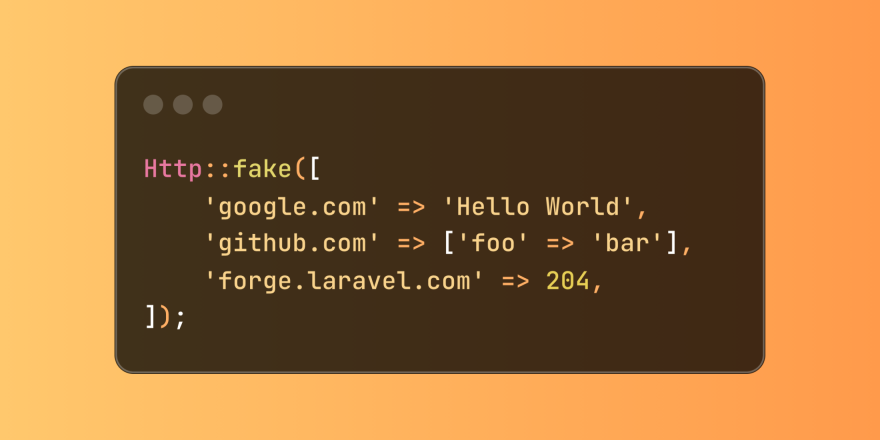
 Simplified HTTP Response Mocking in Laravel TestsMar 12, 2025 pm 05:09 PM
Laravel provides concise HTTP response simulation syntax, simplifying HTTP interaction testing. This approach significantly reduces code redundancy while making your test simulation more intuitive. The basic implementation provides a variety of response type shortcuts: use Illuminate\Support\Facades\Http; Http::fake([ 'google.com' => 'Hello World', 'github.com' => ['foo' => 'bar'], 'forge.laravel.com' =>
 12 Best PHP Chat Scripts on CodeCanyonMar 13, 2025 pm 12:08 PM
Do you want to provide real-time, instant solutions to your customers' most pressing problems? Live chat lets you have real-time conversations with customers and resolve their problems instantly. It allows you to provide faster service to your custom
 PHP Logging: Best Practices for PHP Log AnalysisMar 10, 2025 pm 02:32 PM
PHP logging is essential for monitoring and debugging web applications, as well as capturing critical events, errors, and runtime behavior. It provides valuable insights into system performance, helps identify issues, and supports faster troubleshoot
 Explain the concept of late static binding in PHP.Mar 21, 2025 pm 01:33 PM
Article discusses late static binding (LSB) in PHP, introduced in PHP 5.3, allowing runtime resolution of static method calls for more flexible inheritance.Main issue: LSB vs. traditional polymorphism; LSB's practical applications and potential perfo
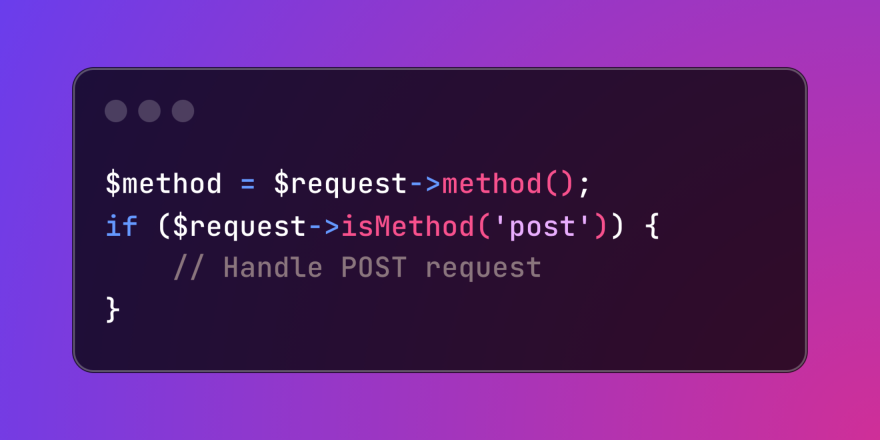
 HTTP Method Verification in LaravelMar 05, 2025 pm 04:14 PM
Laravel simplifies HTTP verb handling in incoming requests, streamlining diverse operation management within your applications. The method() and isMethod() methods efficiently identify and validate request types. This feature is crucial for building
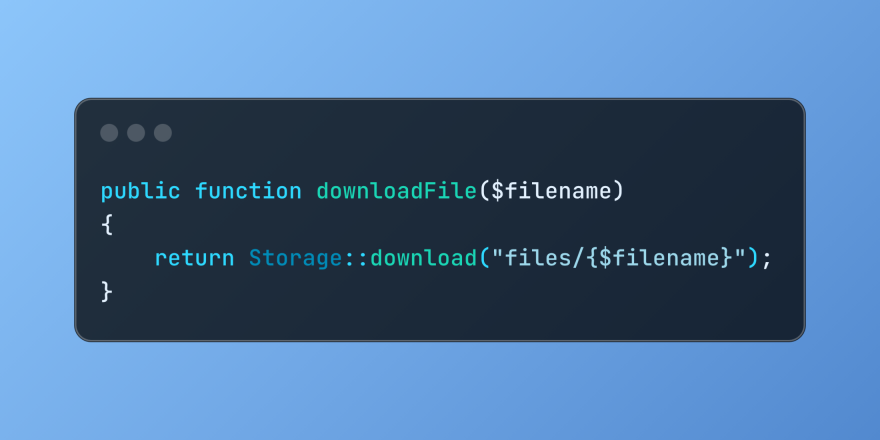
 Discover File Downloads in Laravel with Storage::downloadMar 06, 2025 am 02:22 AM
The Storage::download method of the Laravel framework provides a concise API for safely handling file downloads while managing abstractions of file storage. Here is an example of using Storage::download() in the example controller:


Hot AI Tools

Undresser.AI Undress
AI-powered app for creating realistic nude photos

AI Clothes Remover
Online AI tool for removing clothes from photos.

Undress AI Tool
Undress images for free

Clothoff.io
AI clothes remover

AI Hentai Generator
Generate AI Hentai for free.

Hot Article

Hot Tools

PhpStorm Mac version
The latest (2018.2.1) professional PHP integrated development tool

MantisBT
Mantis is an easy-to-deploy web-based defect tracking tool designed to aid in product defect tracking. It requires PHP, MySQL and a web server. Check out our demo and hosting services.

SublimeText3 Linux new version
SublimeText3 Linux latest version

SecLists
SecLists is the ultimate security tester's companion. It is a collection of various types of lists that are frequently used during security assessments, all in one place. SecLists helps make security testing more efficient and productive by conveniently providing all the lists a security tester might need. List types include usernames, passwords, URLs, fuzzing payloads, sensitive data patterns, web shells, and more. The tester can simply pull this repository onto a new test machine and he will have access to every type of list he needs.

EditPlus Chinese cracked version
Small size, syntax highlighting, does not support code prompt function


