
 Backend DevelopmentPHP TutorialDetailed explanation based on using PHP performance testing tool xhprof in production environment_PHP tutorial
xhprof is a PHP performance testing tool open sourced by Facebook. It can also be called a profile tool. I don’t know how to translate this word to make it more meaningful. Compared with the xdebug I have been using before, there are many similarities. There were some records of xdebug in the past that can be used for reference, but its disadvantage is that it has a great impact on performance. Even if the profiler_enable_trigger parameter is turned on, it is terrible when used in a production environment, and the CPU will immediately reach high.
xhprof is very lightweight, and whether to record profiles can be controlled by the program. Therefore, it is possible to use it in a production environment. You can see such a usage in its documentation:
Enable xhprof with a one-in-10,000 chance, and don’t shoot it quietly at ordinary times.
if (mt_rand(1, 10000) == 1) {
xhprof_enable( XHPROF_FLAGS_MEMORY);
$xhprof_on = true;
}
Call the method at the end of the program to save the profile
if ($xhprof_on) {
// stop profiler
$xhprof_data = xhprof_disable();
// save $xhprof_data somewhere ( say a central DB)
...
}
You can also use the register_shutdown_function method to specify to save the xhprof information at the end of the program, thus eliminating the need to judge at the end and give it a rewrite Incomplete example:
if (mt_rand(1, 10000) == 1) {
xhprof_enable (XHPROF_FLAGS_MEMORY); For the time being, I use the most unsophisticated file format to save it, and just clear it regularly.
BTW: The graphical profile generated by xhprof is really cool. It is clear at a glance which piece of code has become the bottleneck.
by phpe: Here is an example:
Ideas on improving the use of xhprof
 Since xhprof was used in the production environment last year, program debugging and performance optimization in the production environment have brought Lots of conveniences. However, there are still some details that need to be improved during use.
Problem
The profile log of xhprof is saved directly in the form of a file on the production server. It needs to be cleaned regularly, or collected and moved to a tool machine for viewing the log. Since the profile generated by xhprof is a large array, standard php serialize is used when saving it to the file. The log file is relatively large, and it is easy to occupy a lot of server disk space if you are not careful. When viewing the log list, it is difficult to click on each one to view them.
I have some small ideas regarding these issues.
Log storage
Deploy a central log server and use facebook's scribe to collect logs. The xhprof logs generated by the server in the production environment are written to the scribe client, and the client automatically synchronizes them to scribe on the central log server, without occupying local storage space. The changes in the code are also relatively small. Just implement an XhprofRuns class based on the iXHProfRuns interface and adjust the storage method of the save_run method.
Change the serialization method
xhprof defaults to processing the profile information using PHP’s native serialization method before saving it, and I compared igbinary vs two days ago The performance and number of bytes occupied by serialize vs json_encode. In this test, igbinary has certain advantages in all aspects, especially the storage space occupied will be greatly reduced, so I only need to change the serialization method to igbinary_serialize to get improvement.
Optimize list display
I am tired of looking at the big pictures of profile logs one by one. It is time-consuming and labor-intensive and not targeted. So what I am doing now is to directly output the overall execution time of the first 1000 logs in the list of profile logs to the list, and mark the logs with too long execution times in red boldface. After making this small change, when I want to check the operation status, I just click on the red links in the log list to take a look, which really saves time and effort. How to get execution time from xhprof log file? The simple code is as follows
Copy the code
The code is as follows:
/**
* Get execution time from xhprof log
*
* @param string $log file path of xhprof log
* @return int execution time
*/
function getSpentTime($log) {
$profile = unserialize(file_get_contents($log));
return $profile['main() ']['wt'] / 1000;
}

 无法引导到Windows恢复环境Feb 19, 2024 pm 11:12 PM
Windows恢复环境(WinRE)是用于修复Windows操作系统错误的环境。进入WinRE后,您可以执行系统还原、出厂重置、卸载更新等操作。如果无法引导到WinRE,本文将指导您使用修复程序解决此问题。无法引导到Windows恢复环境如果无法引导至Windows恢复环境,请使用下面提供的修复程序:检查Windows恢复环境的状态使用其他方法进入Windows恢复环境您是否意外删除了Windows恢复分区?执行Windows的就地升级或全新安装下面,我们已经详细解释了所有这些修复。1]检查Wi
 Python和Anaconda之间有什么区别?Sep 06, 2023 pm 08:37 PM
在本文中,我们将了解Python和Anaconda之间的差异。Python是什么?Python是一种开源语言,非常重视使代码易于阅读并通过缩进行和提供空白来理解。Python的灵活性和易于使用使其非常适用于各种应用,包括但不限于对于科学计算、人工智能和数据科学,以及创造和发展的在线应用程序。当Python经过测试时,它会立即被翻译转化为机器语言,因为它是一种解释性语言。有些语言,比如C++,需要编译才能被理解。精通Python是一个重要的优势,因为它非常易于理解、开发,执行并读取。这使得Pyth
 CS玩家的首选:推荐的电脑配置Jan 02, 2024 pm 04:26 PM
1.处理器在选择电脑配置时,处理器是至关重要的组件之一。对于玩CS这样的游戏来说,处理器的性能直接影响游戏的流畅度和反应速度。推荐选择IntelCorei5或i7系列的处理器,因为它们具有强大的多核处理能力和高频率,可以轻松应对CS的高要求。2.显卡显卡是游戏性能的重要因素之一。对于射击游戏如CS而言,显卡的性能直接影响游戏画面的清晰度和流畅度。建议选择NVIDIAGeForceGTX系列或AMDRadeonRX系列的显卡,它们具备出色的图形处理能力和高帧率输出,能够提供更好的游戏体验3.内存电
 如何在Go中使用第三方库?May 11, 2023 pm 03:30 PM
在Go语言中,使用第三方库是非常方便的。许多优秀的第三方库和框架可以帮助我们快速地开发应用程序,同时也减少了我们自己编写代码的工作量。但是如何正确地使用第三方库,确保其稳定性和可靠性,是我们必须了解的一个问题。本文将从以下几个方面介绍如何使用第三方库,并结合具体例子进行讲解。一、第三方库的获取Go语言中获取第三方库有以下两种方式:1.使用goget命令首先
 php集成环境包有哪些Jul 24, 2023 am 09:36 AM
php集成环境包有:1、PhpStorm,功能强大的PHP集成环境;2、Eclipse,开放源代码的集成开发环境;3、Visual Studio Code,轻量级的开源代码编辑器;4、Sublime Text,受欢迎的文本编辑器,广泛用于各种编程语言;5、NetBeans,由Apache软件基金会开发的集成开发环境;6、Zend Studio,为PHP开发者设计的集成开发环境。
 如何在 Windows 11 中按需使用 OneDrive 的文件Apr 14, 2023 pm 12:34 PM
<p>Windows 系统上的 OneDrive 应用程序允许您将文件存储在高达 5 GB 的云上。OneDrive 应用程序中还有另一个功能,它允许用户选择一个选项,是将文件保留在系统空间上还是在线提供,而不占用您的系统存储空间。此功能称为按需文件。在这篇文章中,我们进一步探索了此功能,并解释了有关如何在 Windows 11 电脑上的 OneDrive 中按需使用文件的各种选项。</p><h2>如何使用 On
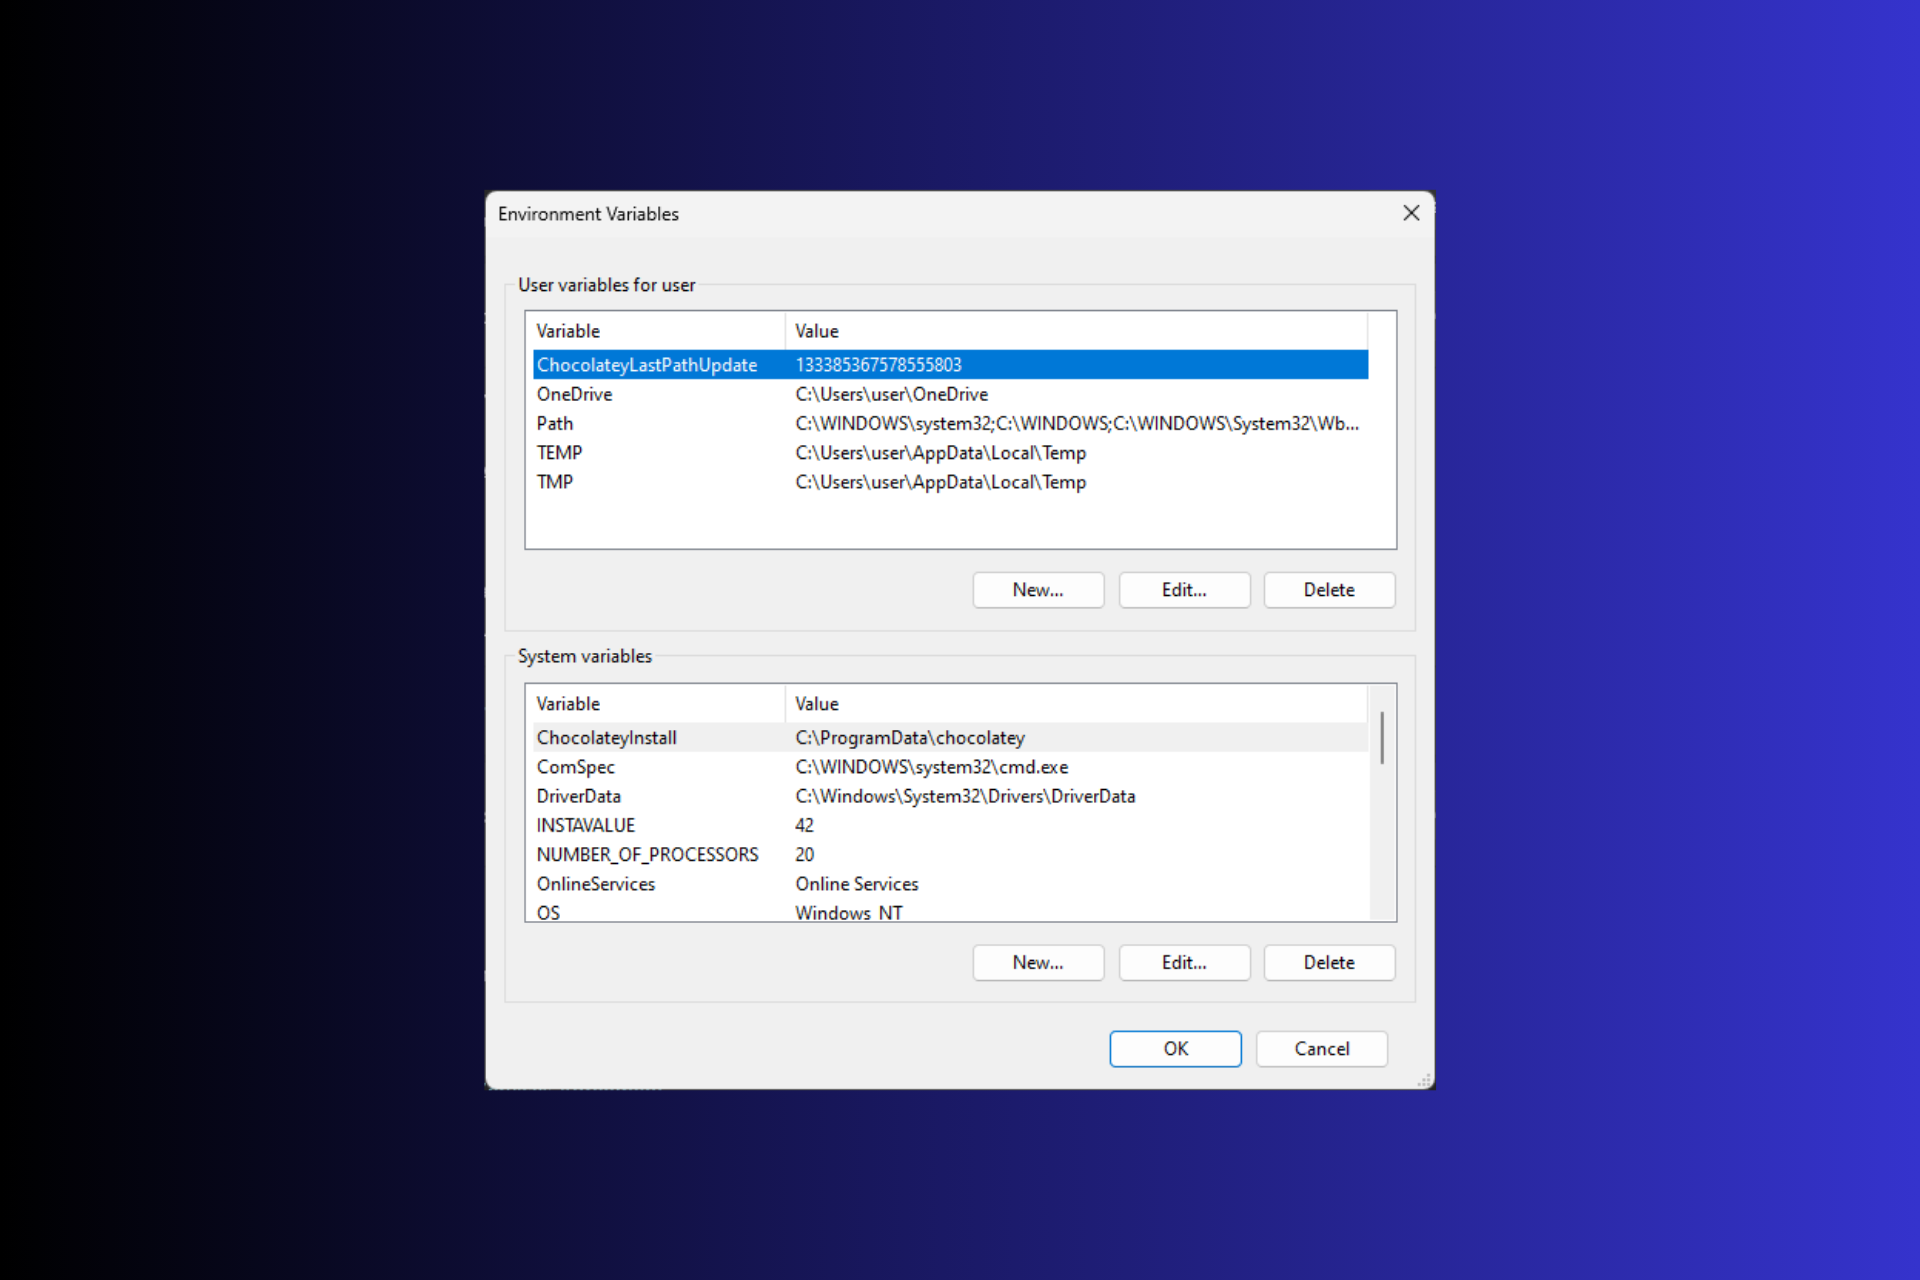 在 Windows 3 上设置环境变量的 11 种方法Sep 15, 2023 pm 12:21 PM
在Windows11上设置环境变量可以帮助您自定义系统、运行脚本和配置应用程序。在本指南中,我们将讨论三种方法以及分步说明,以便您可以根据自己的喜好配置系统。有三种类型的环境变量系统环境变量–全局变量处于最低优先级,可由Windows上的所有用户和应用访问,通常用于定义系统范围的设置。用户环境变量–优先级越高,这些变量仅适用于在该帐户下运行的当前用户和进程,并由在该帐户下运行的用户或应用程序设置。进程环境变量–具有最高优先级,它们是临时的,适用于当前进程及其子进程,为程序提供
 如何在Go中使用反转依赖?May 11, 2023 pm 03:39 PM
Go语言中的反转依赖是一种非常实用的技术,它可以帮助开发者更好地进行软件开发。在本文中,我们将详细介绍什么是反转依赖,并且演示如何在Go语言中使用它来优化软件。一、什么是反转依赖在传统的软件开发中,模块之间存在着依赖关系。一些模块被其他模块所依赖,而另一些模块则依赖于其他模块。这种依赖关系在软件中非常普遍,但同时也会带来很多问题。一旦一个模块的代码发生了变化


Hot AI Tools

Undresser.AI Undress
AI-powered app for creating realistic nude photos

AI Clothes Remover
Online AI tool for removing clothes from photos.

Undress AI Tool
Undress images for free

Clothoff.io
AI clothes remover

AI Hentai Generator
Generate AI Hentai for free.

Hot Article
Hot Tools

MantisBT
Mantis is an easy-to-deploy web-based defect tracking tool designed to aid in product defect tracking. It requires PHP, MySQL and a web server. Check out our demo and hosting services.

Atom editor mac version download
The most popular open source editor

Dreamweaver Mac version
Visual web development tools

Notepad++7.3.1
Easy-to-use and free code editor

SublimeText3 English version
Recommended: Win version, supports code prompts!

