





nginx无慢查询概念,所谓“慢查询”实为后端响应延迟在代理层的表象;需通过$request_time与$upstream_response_time等日志字段定位慢接口、节点及请求,并联动后端request_id与db慢日志交叉验证瓶颈。
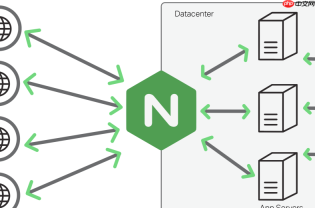
排查高并发下的慢查询与接口超时,不能把 Nginx 当作数据库或应用层来查“慢查询”——它本身不执行 SQL、不处理业务逻辑。所谓“Nginx 中的慢查询”,实际是后端响应延迟在代理层的投射。关键在于:用访问日志当线索,快速定位哪类请求、哪个上游节点、哪个时间窗口正在拖垮整体链路。
一、先让 access.log 能说话
默认日志格式(combined)不含任何耗时字段,看再多行也看不出快慢。必须启用含时间维度的自定义格式:
- 至少包含 $request_time(Nginx 全程处理耗时)和 $upstream_response_time(后端真实响应耗时)
- 强烈建议补全:$upstream_addr(具体后端 IP:port)、$upstream_connect_time(建连耗时)、$status 和 $request
- 示例配置:log_format trace '$remote_addr - [$time_local] "$request" $status $body_bytes_sent $request_time $upstream_response_time $upstream_connect_time $upstream_addr';
- 将该格式用于独立日志文件(如 /var/log/nginx/slow.log),避免干扰常规分析
二、用命令快速筛出“真慢请求”
不依赖可视化工具,一条 awk 就能抓住问题脉络:

- 找总耗时 >1s 的请求:awk '$NF > 1' /var/log/nginx/slow.log | head -20($NF 默认为最后一列,即 $upstream_response_time 或 $request_time,需按实际列序调整)
- 看哪些后端最常超时:awk '$8 > 1 {print $9}' /var/log/nginx/slow.log | sort | uniq -c | sort -nr(假设第 8 列是 upstream_response_time,第 9 列是 upstream_addr)
- 识别“假慢”:若 $request_time 显著大于 $upstream_response_time(比如差值 >500ms),说明瓶颈不在后端,可能在客户端弱网、SSL 握手、大响应体传输或 Nginx gzip 压缩环节
三、结合 error.log 锁定失败模式
access.log 告诉你“谁慢了”,error.log 告诉你“为什么卡住”:
- 高频出现 "upstream timed out" → 后端响应超时,需比对 proxy_read_timeout 与后端 P99 耗时是否匹配
- 大量 "client timed out while reading request" → 客户端发请求头太慢,常见于移动端弱网或恶意扫描
- 反复报 "upstream response is buffered to a temporary file" → proxy_buffer 不足,响应体被刷盘,I/O 拖慢吞吐,尤其影响图片/API 大返回
- 出现 "worker_connections are not enough" → 连接数见顶,可能因 keepalive_timeout 过长或后端慢导致连接堆积
四、归因三类典型场景
根据日志字段组合,直接对应到根因方向:
- 后端服务慢:$upstream_response_time 高 + $request_time ≈ $upstream_response_time → 查对应应用日志、DB 慢查询、JVM GC 或 CPU 使用率
- 网络或连接问题:$upstream_connect_time 高(>300ms)+ $upstream_response_time 正常 → 检查后端负载、DNS 解析、TCP 连接池、跨机房网络质量
- 客户端或 Nginx 自身瓶颈:$request_time 高但 $upstream_response_time 很低(如


