





nginx error_log 不支持直接写入 $upstream_response_time 等动态变量,但可通过 access_log 条件记录慢请求、error_log 记录带 request_id 的错误事件、外部脚本或监控系统关联分析三步实现耗时明细追踪。
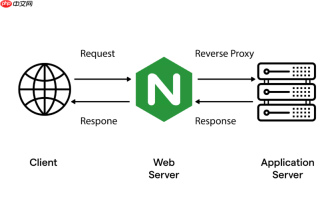
Nginx 本身不支持直接在 error_log 中按条件写入 $upstream_response_time 或其他耗时变量,因为 error_log 指令只接受固定字符串和少量预定义变量(如 $pid, $remote_addr),不支持 $upstream_response_time、$request_time 等动态时间变量。但你可以通过“日志分级 + 条件记录 + 外部过滤”组合方案,实现在错误日志上下文里精准捕获慢响应的耗时明细。
下面分三步说明可落地的做法:
配置带耗时字段的访问日志并启用慢请求标记
先确保 access_log 记录完整耗时信息,并用 map 或 if 标记慢请求,便于后续筛选:
http {
    # 定义慢请求阈值(单位:秒)
    map $upstream_response_time $is_slow {
        default 0;
        ~^[0-9]+\.[5-9][0-9]{2,}$ 1;  # > 0.5s(正则粗筛,实际建议用 log_if)
        ~^[1-9]\.[0-9]{3,}$         1;  # ≥ 1.0s
    }

    log_format slow_detail
        '$remote_addr - $remote_user [$time_local] '
        '"$request" $status $body_bytes_sent '
        'rt=$request_time urt=$upstream_response_time '
        'uct=$upstream_connect_time uht=$upstream_header_time '
        'up_addr=$upstream_addr up_status=$upstream_status '
        'is_slow=$is_slow';

    access_log /var/log/nginx/access.log slow_detail;
}
⚠️ 注意:
map对浮点数匹配较弱,生产环境推荐用log_if(需 Nginx ≥ 1.7.12)更可靠:log_if $upstream_response_time > 0.5; access_log /var/log/nginx/slow.log slow_detail if=$log_if;
这样,所有 upstream_response_time > 0.5s 的请求会单独写入 slow.log,内容含完整耗时分段(连接、首包、总响应)、后端地址、状态码等。
在 error_log 中关联慢请求上下文(间接方式)
虽然不能直接往 error_log 写 urt=0.823,但可通过以下方式让错误日志“指向”慢请求:
-
启用
error_log记录代理超时/失败事件,并带上$request_id和$upstream_addr:proxy_next_upstream error timeout http_500 http_502; proxy_next_upstream_tries 3; proxy_next_upstream_timeout 10s; # 注入唯一 ID,便于日志串联 proxy_set_header X-Request-ID $request_id; add_header X-Request-ID $request_id always; # 错误日志中记录关键标识 error_log /var/log/nginx/error.log warn;
-
在
location块中,当检测到上游异常时,用return或add_header触发显式日志(需配合调试级 error_log):location /api/ { proxy_pass http://backend; proxy_intercept_errors on; # 若 upstream_status 非 200,触发 warn 级 error_log(Nginx 自动记录) # 不需要手动写,proxy 模块在超时/502/504 时自动记 error_log,含 upstream 地址和 request_id }

此时,error.log 会出现类似:
2026/07/30 02:45:12 [error] 12345#0: *6789 upstream timed out (110: Connection timed out) while reading response header from upstream, client: 192.168.1.100, server: api.example.com, request: "GET /user/profile HTTP/1.1", upstream: "http://10.0.1.20:8080/user/profile", host: "api.example.com", referrer: "-", request_id: "a1b2c3d4e5"
→ 这条 error 日志里的 request_id 和 upstream 地址,可与 slow.log 中同 ID 的行精确匹配,拿到对应 urt=2.341 等明细。
用脚本或日志系统自动关联分析(实用闭环)
真正实现“错误发生时立刻看到耗时明细”,靠的是后处理:
-
实时聚合脚本示例(bash + awk):
# 监控 error.log 中新出现的超时/504,并提取 request_id
tail -f /var/log/nginx/error.log | \
  grep -E 'upstream timed out|504 Gateway Timeout' | \
  sed -n 's/.*request_id: "\([^"]*\)".*/\1/p' | \
  while read rid; do
    # 查 slow.log 中该 ID 对应的完整耗时行
    awk -v id="$rid" '$12 == id {print}' /var/log/nginx/slow.log | \
      logger -t nginx-slow-context -p local0.info
  done
输出到 syslog 的
local0.info,即可在集中日志平台(如 Loki、ELK)中与 error 日志同屏查看。 -
Prometheus + Grafana 方案(推荐):
- 用
nginx-lua-prometheus或nginx-module-vts暴露upstream_response_time分位数指标; - 设置告警规则:
upstream_response_time_seconds_quantile{quantile="0.99"} > 1.0; - 告警触发时,自动携带
label_values(upstream_addr)和request_id,跳转到日志系统查原始明细。
- 用
本质上,Nginx 的 error_log 是“问题发生器”,access_log(尤其是带条件的 slow 日志)是“明细记录仪”,两者靠 request_id 和 upstream_addr 关联,才是稳定可靠的慢响应追踪链。
不复杂但容易忽略。


