Building a PHP5.6 environment under WIN8.1
Many people like to use Linux to build a PHP web language running environment, but because Linux is highly customized, root is often required The running command is slightly high-end and corresponds to Microsoft's Windows operating system. The user experience is good. You can use the IIS component PHP package that comes with Windows to build a suitable operating environment.
The first time I came into contact with PHP was around 2014-May. At that time, my main focus was C#, and I was quite repulsive to PHP. Part of the reason was that PHP's breakpoint debugging could not be configured successfully. I used echo to print the log. The method of debugging made me resentful of PHP and missed a good opportunity to learn PHP in depth. I am writing this essay this time, on the one hand, to record my departure in the direction of PHP, and on the other hand, I hope to help beginners who are new to PHP, so that they can smoothly configure the PHP environment without fear of PHP.
1. Introduction to system environment
Windows system is a very common system. I believe there is no need to explain more here. So how to open IIS (win8.1), there are actually many tutorials on the Internet, I will only give a brief introduction here.
①Install .net fromework 3.5
IIS operation depends on .net3.5, so the first step is to install .net fromework3.5. There are roughly two installation methods. One is online downloading, which is very slow (really very slow). Here I will introduce to you the second one, offline installation of .net fromework3.5. Find the iso file for installing win8 and load it into the virtual optical drive. If you have a USB flash drive system, just insert the USB flash drive. Run "Command Prompt (Administrator)" (right-click the Win icon on the desktop) and enter the command "dism.exe /online /enable-feature /featurename:NetFX3 /Source:V:sourcessxs". The V drive represents the drive letter of the virtual optical drive. Or the drive letter of the USB flash drive.
②Enable IIS
For developers, it should be a small case to enable IIS. Not much to say here.
2. Installation
The initial IIS does not support php, so we first downloaded the PHP Manager tool. After successful installation, you can see the php manager icon in IIS, as shown below:

Enter php manager. The subsequent configuration is relatively simple, please search it yourself. The focus of this article is on breakpoint debugging, so I won’t go into details. After the php configuration is completed, you will see the following interface:

Copy the downloaded xdebug decompressed file to the ext folder of the php directory

The next step is to install the IDE. The PHPStorm installation is very simple. I won’t go into details here. Xdebug helper is an extension tool for Chrome. Enter chrome://extensions/ in the browser and then download it. Just drag the crx file into the page.

3. Configuration
①Xdebug
There are many Xdebug configurations online. Here I only give my configuration. In the php.ini file, add the following code and pay attention to the locations of several of the files.
?
|
1
2
3
4
5
6
7
8
9
10
11
12
13
14
15
16
17
|
<font face="NSimsun">[Xdebug] ;xdebug配置 </font>zend_extension="D:/php/php-5.6.8-nts-Win32-VC11-x64/ext/php_xdebug-2.3.2-5.6-vc11-nts-x86_64.dll" <code class="php plain"><font face="NSimsun">;载入Xdebug </font>;Load Xdebug xdebug.idekey="PHPSTORM"<font face="NSimsun">xdebug.profiler_enable=on </font>xdebug.profiler_enable=on <div class="line number5 index4 alt2">
<font face="NSimsun">
<code class="php plain">xdebug.trace_output_dir="D:/php/xdebug-log"<font face="NSimsun">;xdebug 的数据文件目录 </font> <div class="line number6 index5 alt1">;xdebug data file directory <font face="NSimsun"><code class="php plain">xdebug.profiler_output_dir=
"D:/php/xdebug-log"<font face="NSimsun">;xdebug 的数据文件目录 </font><code class="php plain"><font face="NSimsun">xdebug.auto_trace = On ;开启自动跟踪 </font>;xdebug data file directory <font face="NSimsun">xdebug.show_exception_trace = On ;开启异常跟踪 </font>xdebug.auto_trace = On ; turn on automatic tracing <div class="line number9 index8 alt2">
<code class="php plain"><font face="NSimsun">xdebug.remote_autostart = Off ;开启远程调试自动启动 </font>
<div class="line number10 index9 alt1">xdebug.show_exception_trace = On ; Turn on exception tracking <code class="php plain"><font face="NSimsun">xdebug.remote_enable = On ;开启远程调试 </font>
<code class="php plain"><font face="NSimsun">xdebug.remote_handler=dbgp ;用于zend studio远程调试的应用层通信协议 </font>xdebug.remote_autostart = Off; turn on remote debugging to start automatically <font face="NSimsun">xdebug.remote_host=localhost ;允许连接的zend studio的IP地址 </font>xdebug.remote_enable = On ; turn on remote debugging <div class="line number13 index12 alt2">
<code class="php plain"><font face="NSimsun">xdebug.remote_port=9001 ;反向连接zend studio使用的端口 </font>
<div class="line number14 index13 alt1">xdebug.remote_handler=dbgp;Application layer communication protocol for zend studio remote debugging <code class="php plain"><font face="NSimsun">xdebug.collect_vars = On ;收集变量 </font>
<code class="php plain"><font face="NSimsun">xdebug.collect_return = On ;收集返回值 </font>xdebug.remote_host=localhost ;IP address of zend studio that allows connection <font face="NSimsun">xdebug.collect_params = On ;收集参数 </font>xdebug.remote_port=9001; Reverse connection to the port used by zend studio <div class="line number17 index16 alt2">
<code class="php plain"><font face="NSimsun">xdebugbug.max_nesting_level = 10000 ;如果设得太小,函数中有递归调用自身次数太多时会报超过最大嵌套数错</font>
xdebug.collect_vars = On ;Collect variables
|
xdebug.collect_params = On; collect parameters
xdebugbug.max_nesting_level = 10000; If set too small, the function will report an error exceeding the maximum nesting number if it calls itself recursively too many times
②PHPStorm
Enter php settings

Select php language settings

Add an interpreter. In fact, if you are running in IIS, you do not need to add an interpreter. However, if you open your php code directly through phpstorm, you need to add an interpreter, as follows, press Alt F2. Running php through the interpreter does not require installing IIS


The next step is to configure phpStorm’s debug. In fact, phpstorm's debug basically has default settings, but we'd better modify it because port 9000 may be occupied by other applications. So we need to change to other port such as 9001


Note: The port here must be consistent with the port configuration in xdebug in php.ini. Please see the configuration code above.
xdebug.remote_port=9001; Reverse connection to the port used by zend studio
③xdebug helper
It is a plug-in for Chrome. It is really easy to use and the configuration is very simple. Just go to the picture above


This configuration is basically over. Let’s test it below.
IV. Breakpoint debugging and testing
① Find the page, turn on debugging, click on the bug, and select Debug.

②PHPstorm turns on monitoring

Refresh the page http://localhost/php/FirstPHP.php

Running results:

The result runs correctly. This article ends here. I hope it can be helpful to the viewers.
The above is the entire content of this article, I hope you all like it.
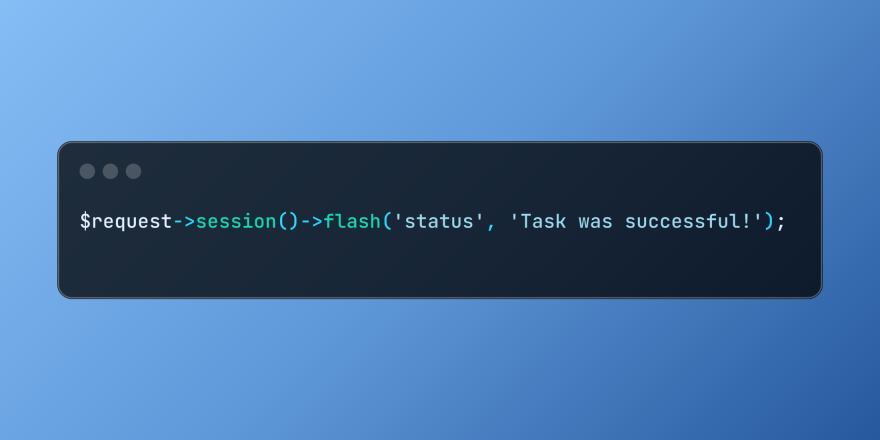
 Working with Flash Session Data in LaravelMar 12, 2025 pm 05:08 PM
Laravel simplifies handling temporary session data using its intuitive flash methods. This is perfect for displaying brief messages, alerts, or notifications within your application. Data persists only for the subsequent request by default: $request-
 cURL in PHP: How to Use the PHP cURL Extension in REST APIsMar 14, 2025 am 11:42 AM
The PHP Client URL (cURL) extension is a powerful tool for developers, enabling seamless interaction with remote servers and REST APIs. By leveraging libcurl, a well-respected multi-protocol file transfer library, PHP cURL facilitates efficient execution of various network protocols, including HTTP, HTTPS, and FTP. This extension offers granular control over HTTP requests, supports multiple concurrent operations, and provides built-in security features.
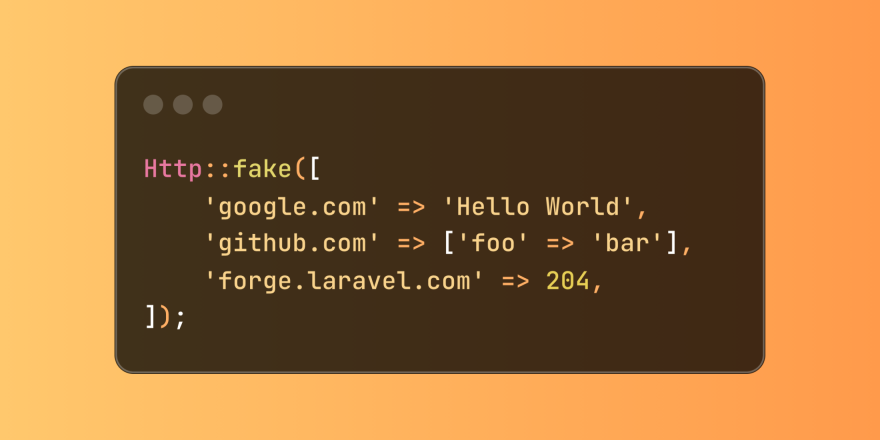
 Simplified HTTP Response Mocking in Laravel TestsMar 12, 2025 pm 05:09 PM
Laravel provides concise HTTP response simulation syntax, simplifying HTTP interaction testing. This approach significantly reduces code redundancy while making your test simulation more intuitive. The basic implementation provides a variety of response type shortcuts: use Illuminate\Support\Facades\Http; Http::fake([ 'google.com' => 'Hello World', 'github.com' => ['foo' => 'bar'], 'forge.laravel.com' =>
 How to Register and Use Laravel Service ProvidersMar 07, 2025 am 01:18 AM
Laravel's service container and service providers are fundamental to its architecture. This article explores service containers, details service provider creation, registration, and demonstrates practical usage with examples. We'll begin with an ove
 12 Best PHP Chat Scripts on CodeCanyonMar 13, 2025 pm 12:08 PM
Do you want to provide real-time, instant solutions to your customers' most pressing problems? Live chat lets you have real-time conversations with customers and resolve their problems instantly. It allows you to provide faster service to your custom
 PHP Logging: Best Practices for PHP Log AnalysisMar 10, 2025 pm 02:32 PM
PHP logging is essential for monitoring and debugging web applications, as well as capturing critical events, errors, and runtime behavior. It provides valuable insights into system performance, helps identify issues, and supports faster troubleshoot
 Explain the concept of late static binding in PHP.Mar 21, 2025 pm 01:33 PM
Article discusses late static binding (LSB) in PHP, introduced in PHP 5.3, allowing runtime resolution of static method calls for more flexible inheritance.Main issue: LSB vs. traditional polymorphism; LSB's practical applications and potential perfo
 Customizing/Extending Frameworks: How to add custom functionality.Mar 28, 2025 pm 05:12 PM
The article discusses adding custom functionality to frameworks, focusing on understanding architecture, identifying extension points, and best practices for integration and debugging.


Hot AI Tools

Undresser.AI Undress
AI-powered app for creating realistic nude photos

AI Clothes Remover
Online AI tool for removing clothes from photos.

Undress AI Tool
Undress images for free

Clothoff.io
AI clothes remover

AI Hentai Generator
Generate AI Hentai for free.

Hot Article

Hot Tools

ZendStudio 13.5.1 Mac
Powerful PHP integrated development environment

WebStorm Mac version
Useful JavaScript development tools

Notepad++7.3.1
Easy-to-use and free code editor

mPDF
mPDF is a PHP library that can generate PDF files from UTF-8 encoded HTML. The original author, Ian Back, wrote mPDF to output PDF files "on the fly" from his website and handle different languages. It is slower than original scripts like HTML2FPDF and produces larger files when using Unicode fonts, but supports CSS styles etc. and has a lot of enhancements. Supports almost all languages, including RTL (Arabic and Hebrew) and CJK (Chinese, Japanese and Korean). Supports nested block-level elements (such as P, DIV),

MinGW - Minimalist GNU for Windows
This project is in the process of being migrated to osdn.net/projects/mingw, you can continue to follow us there. MinGW: A native Windows port of the GNU Compiler Collection (GCC), freely distributable import libraries and header files for building native Windows applications; includes extensions to the MSVC runtime to support C99 functionality. All MinGW software can run on 64-bit Windows platforms.


