





直接查nginx错误日志中“upstream timed out”记录,可确认504系网关等待后端响应超时所致;需提取upstream地址、client ip及request uri,并结合access.log中$request_time字段(如60.123秒)比对proxy_read_timeout等配置值,进而定位是参数过小还是后端真实延迟。
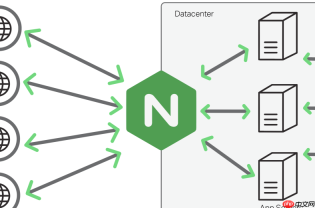
直接看 Nginx 错误日志里有没有 504 Gateway Timeout,这是最明确的信号——说明 Nginx 等待后端响应超时了。
重点查 error.log 中的 504 记录
Nginx 把超时判定为错误,会记到 /var/log/nginx/error.log(路径以实际配置为准)。执行:
tail -f /var/log/nginx/error.log | grep "504"
典型日志示例:
2026/06/13 22:18:42 [error] 12345#0: *6789 upstream timed out (110: Connection timed out) while reading response header from upstream, client: 192.168.10.55, server: api.example.com, request: "GET /order/123 HTTP/1.1", upstream: "http://backend:8080/order/123", host: "api.example.com"
关键信息提取:
- upstream timed out:明确是上游(后端)超时
- while reading response header:Nginx 已发请求给后端,但迟迟没收到响应头
- upstream: "http://backend:8080/...":指向具体后端地址,可据此定位服务
- client IP 和 request URI:便于复现或关联业务场景
结合 access.log 对齐时间与请求
单看 error.log 只知道“超时”,但不知道“多慢”。需同步查 access.log:
grep "12345#0: \*6789" /var/log/nginx/access.log
找到同一连接 ID(如 *6789)在 access.log 中的记录,通常包含 $request_time 字段,例如:

192.168.10.55 - - [13/Jun/2026:22:18:42 +0800] "GET /order/123 HTTP/1.1" 504 563 "-" "curl/7.68.0" 60.123
末尾的 60.123 就是总耗时(秒),说明这次请求卡了整整 60 秒才被 Nginx 主动中断——这基本等于你配置的 proxy_read_timeout 值。
确认并核对 Nginx 超时参数
查当前生效的 proxy 超时设置:
nginx -T 2>/dev/null | grep -E "(proxy_(connect|send|read)_timeout|upstream)"
重点关注三项:
-
proxy_connect_timeout:Nginx 连后端的建连超时(一般设 5–10s) -
proxy_send_timeout:Nginx 向后端发完请求后,等待后端接收完成的超时 -
proxy_read_timeout:最常触发 504 的参数,即等待后端返回响应头/体的总时间
如果 access.log 显示耗时接近某个 timeout 值(比如总是卡在 60s),而该值又明显小于业务合理耗时,那大概率就是这个参数太小,或者后端真卡住了。
排除 Nginx 自身瓶颈,聚焦后端
确认不是 Nginx 进程卡死或资源不足:
- 用
top或htop看 nginx worker 进程 CPU/内存是否异常飙高 - 用
ss -s查看 ESTAB 连接数是否接近worker_connections上限 - 检查
error.log是否同时出现no live upstreams或connection refused—— 那可能是后端进程挂了,而非单纯慢
若 Nginx 自身健康,且日志稳定出现带 upstream timed out 的 504,问题就基本锁定在后端应用响应延迟上,下一步应去查对应服务的日志、线程堆栈和数据库慢查询。


