


宝塔面板中xdebug 3.x的profiling需设xdebug.mode=profile而非旧版xdebug.profiler_enable,配合xdebug.profile_trigger=1和触发参数url调用,生成cachegrind文件后用phpstorm或webgrind分析。

宝塔面板里开 Xdebug profiling 不是为了日常调试,而是为了定位 PHP 脚本慢在哪——但直接照搬旧教程(比如写 xdebug.profiler_enable=On)大概率失败,因为 PHP 8.0+ 的 Xdebug 3.x 已废弃该配置项,且 profiling 和 debug 模式互斥,不能共存。
确认 Xdebug 3.x 是否已启用并支持 profiling
Profiling 功能在 Xdebug 3 中被整合进 xdebug.mode,不再有独立开关。先验证当前 PHP 实例是否真加载了兼容版本:
- 执行
sudo -u www /www/server/php/80/bin/php -v,输出中必须含Xdebug v3.1+;若显示v2.9或报错Invalid configuration directive 'xdebug.profiler_enable',说明版本不匹配,需卸载重装 - 运行
sudo -u www /www/server/php/80/bin/php --ri xdebug,检查输出里是否有Supported directives列表,且包含xdebug.mode和xdebug.output_dir—— 缺任一即不可用 profiling - 宝塔后台「软件商店 → PHP-8.0 → 安装扩展」中勾选的 Xdebug 若是灰色或安装后
php -m | grep xdebug无输出,说明没绑定到该 PHP 版本,得手动进/www/server/php/80/src运行pecl install xdebug
修改 php.ini 启用 profiling 模式(不是 debug)
xdebug.mode=debug 会禁用 profiling,xdebug.mode=profile 才生成 cachegrind 文件。别混用,也别加 develop 或多个值——Xdebug 3 只接受单值或逗号分隔的合法组合(如 debug,profile),但 profiling + debug 同时开会导致性能雪崩,生产环境绝对禁止。
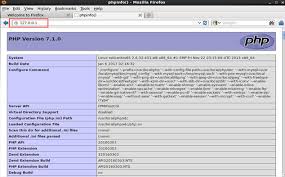
- 编辑
/www/server/php/80/etc/php.ini,在末尾添加(注意路径与实际.so文件一致):zend_extension = /www/server/php/80/lib/php/extensions/no-debug-non-zts-20200930/xdebug.so xdebug.mode = profile xdebug.output_dir = /tmp xdebug.profile_trigger = 1 xdebug.profile_trigger_value = "profiler"
-
xdebug.profile_trigger = 1表示仅当 URL 带?XDEBUG_PROFILE=profiler时才启动 profiling,避免全站请求都写日志拖垮服务 -
/tmp目录需有写权限:sudo chmod 1777 /tmp,否则生成失败且无报错提示 - 删掉所有
xdebug.profiler_enable、xdebug.collect_params等 Xdebug 2.x 遗留参数,它们会让 PHP 启动失败,宝塔会自动禁用该 PHP 版本
生成并分析 cachegrind 文件
Profiling 文件默认名是 cachegrind.out.<pid></pid>,放在 /tmp 下,但直接看文本毫无意义——得用 Webgrind 或 PhpStorm 自带分析器。
- 访问目标页面时加上触发参数,例如:
https://yoursite.com/index.php?XDEBUG_PROFILE=profiler - 检查
/tmp是否生成新文件:ls -lt /tmp/cachegrind.out*,若无,立刻查xdebug.log(需提前在 php.ini 加xdebug.log=/tmp/xdebug.log) - 把文件下载到本地,用 PhpStorm 打开:菜单
Tools → Analyze Xdebug Profiler Snapshot;或部署 Webgrind(推荐用宝塔建个子目录站点,把 Webgrind 代码放进去,改config.php中$settings['profiler_file_path'] = '/tmp';) - 注意:每个请求生成一个文件,别让缓存插件(如 OPcache、Redis)干扰结果——临时关闭它们,否则看到的是缓存命中路径,不是真实执行瓶颈
真正卡点往往不在函数本身,而在数据库查询未加索引、file_get_contents 外部接口没设超时、或循环里反复 new 对象。Profiling 报告里 inclusive time 高但 self time 低的函数,基本就是“背锅”的调用方,得顺藤摸瓜看它调了谁。另外,别忘了 profiling 期间 OPcache 和 JIT 全被 Xdebug 强制禁用,测出的数据只反映“无优化裸跑”状态,不能直接等同线上延迟。
php免费学习视频:立即使用
踏上前端学习之旅,开启通往精通之路!从前端基础到项目实战,循序渐进,一步一个脚印,迈向巅峰!



