


In this tutorial, we will explore the significance of the status bar in Excel, explain how to customize it for optimal productivity, and unveil its hidden powers to conquer data tasks like a pro.
Microsoft Excel offers an array of powerful features that aid in data analysis, calculation, and presentation. Among these features, the status bar quietly sits at the bottom of the Excel window, delivering essential information about the worksheet and selected cells.
What is the status bar in Excel?
Excel Status Bar is a horizontal bar at the bottom of the worksheet window. It serves as an informational hub, displaying important details about the current status of your spreadsheet and providing quick access to various Excel features. The status bar presents real-time stats for selected cells or ranges, such as sum, average, and count. It also offers convenient shortcuts to toggle specific options such as macro recording, page layout, and zoom.

Default options on Excel status bar
By default, the Excel status bar displays a range of useful information and functionalities. Here are some of the common options you'll find on the status bar in every worksheet:
- Cell mode
- Macro recording icon
- Accessibility check
- Worksheet views
- Page number
- Zoom options
Cell mode
On the left-most side of the Excel status bar, the cell mode indicator awaits your attention. This indicator serves as a helpful visual cue, informing you about the current state of the active cell. It keeps you aware of whether you are in a ready state, editing content, confirming changes, or referring to other cells.
- Ready. When you first open or navigate to a new worksheet, the cell mode indicator typically shows Ready. This means that the selected cell is ready to receive input or perform actions, so you can directly start typing or editing the contents of the cell.
- Enter. Indicates that you are entering information into the cell. It is activated when you select a cell and start typing, or when you press F2 twice.
- Edit. When you double-click a cell or press the F2 key, the cell mode switches to Edit, indicating in-cell editing. In this mode, you can navigate within the cell, make changes, and use various keyboard shortcuts specific to editing.
- Point. Indicates a formula cell selection mode. It is displayed when you start creating a formula and click on the cells that you wish to use as a reference. This mode signifies that the selected cell is pointing to other cells elsewhere in the workbook.

Macro recording icon
Next to the cell mode indicator on the left side of the status bar, you'll find the Macro Recording icon. It allows you to automate repetitive tasks by recording a series of actions as a macro. Click this icon to initiate the recording process, and then perform the desired actions within the spreadsheet. While the macro is being recorded, the icon transforms into a transparent square, providing a visual indication of the active recording process. To stop recording, simply click on this icon, and it will return to its original appearance.

For more information, see How to record a macro in Excel.
Accessibility check
Positioned next to the Macro Recording icon on the status bar is the Accessibility Check option. This feature lets you evaluate the accessibility of your spreadsheet and ensure it can be effectively used by everyone including users with disabilities.
When you initiate the accessibility check, Excel examines various aspects such as cell formatting, document structure, and worksheet readability. It highlights any potential problems that might affect individuals with visual impairments, cognitive disabilities, or other accessibility needs.
If any accessibility issues are present in your workbook, the status bar will display Accessibility: Investigate. Clicking on this text will open the Accessibility pane, which provides guidance on how to enhance the accessibility of your workbook for everyone.

Conversely, if no issues are found, the status bar will display Accessibility: Good to Go, indicating that your workbook meets accessibility standards.
Overall, the Accessibility Check option provides valuable insights and recommendations to make your spreadsheet more inclusive and user-friendly.
Workbook views
On the right side of the status bar in Excel, you'll notice the three Workbook views options. These options allow you to switch between different viewing modes to optimize your workspace and focus on specific aspects of your workbook.
Normal View - the default workbook view. It provides a standard layout with gridlines, headers, and footers.
Page Layout View - offers a more visual representation of your worksheets. It simulates how the printed pages will look, including margins, page breaks, and backgrounds. This view is particularly useful for designing and adjusting the layout of your workbook for printing or sharing as a PDF.
Page Break Preview - displays your worksheets with visible page breaks, enabling you to see exactly how the content will be split across multiple pages when printed. You can adjust page breaks and make necessary modifications to ensure optimal page formatting.

Tip. These options are also accessible on the View tab of the Excel ribbon.
Page number
When working with a worksheet that is divided into multiple printed pages (Page Layout view), the Page Number option shows you the total number of pages in the sheet as well as the current page number.

Zoom options
As the rightmost option on the status bar in Excel, you have the Zoom options, which give you the ability to modify the zoom level of your workbook's display.
Zoom slider - is a handy tool for adjusting the magnification of your workbook. It appears as a slider bar with a marker that you can drag left or right to decrease or increase the zoom level. As you move the slider, the percentage value displayed next to it changes, indicating the current zoom level. By default, the slider is set to 100%. Moving it to the left zooms out, allowing you to view more rows and columns, while moving it to the right zooms in, providing a closer look at the worksheet.
Zoom in and Zoom out icons - on either side of the zoom slider, there are the Zoom in and Zoom out icons, represented by a plus ( ) and minus (-) symbol respectively. Clicking on these icons changes the zoom level by 10%, which is a quick and convenient way to adjust the zoom level of your workbook without having to use the slider.
Zoom percentage - displays the current zoom level of your workbook. This value represents the relative size of the content compared to the actual size. You can also directly enter a specific percentage value by clicking on the Zoom Percentage value and typing the desired percent.
These Zoom options offer flexibility in adjusting the display size of your workbook to accommodate different screen sizes, readability preferences, or the need to view more or less content at once.

How to customize status bar in Excel
Excel offers flexibility in customizing the status bar to suit your specific needs. Simply right-click on the status bar, to get the full list of available options, and then choose which features you want to see.
Here are the default settings of the status bar in Excel:

Below are some additional customization options available.
Sheet number
As part of the status bar customization, Excel offers the Sheet Number option allowing you to display the active sheet's sequential order within the workbook.
To enable this option, right-click on the status bar and select Sheet Number from the customization menu. Once enabled, the status bar will display the sheet number on the left side, next to the other information already being shown.

Workbook statistics
The Workbook Statistics option in the customized status bar provides a summary of key information about the workbook, giving you insights into its structure and content.
To access this feature, right-click on the status bar and select Workbook Statistics from the menu. A separate window will appear, presenting various details about the current sheet and the entire workbook such as the number of sheets, cells with data, tables and formulas.

Caps Lock, Num Lock, Scroll Lock
With these options enabled, the status bar indicators will provide a visual reminder of the current status of the Caps Lock, Num Lock and Scroll Lock keys on your keyboard, helping you avoid typing mistakes and ensuring accurate data entry.

Note. The Excel status bar only displays the Caps Lock, Num Lock and Scroll Lock status, but does not control it. For more information, see How to turn off Scroll Lock in Excel.
Overtype mode
Overtype is a typing mode in which new characters overwrite existing text as you type, instead of pushing the existing text forward. This can be useful when you need to replace the existing content without manually deleting it.
To toggle the Overtype mode on or off in Excel, simply press the Insert key on your keyboard. When this mode is enabled, the indicator in the status bar will show Overtype, and any new text that you type will replace the characters to the right of the insertion point. When Overtype mode is disabled, the indicator will disappear, and new text will be inserted at the cursor position without replacing the existing values.

Status bar statistics for selected cells
When you select individual cells or a range of cells in a worksheet, the status bar displays various statistics / calculations for the data within the selection, offering a convenient way to gain insights into your data at a glance.
By default, the status bar shows the following stats for the selected cells:
- Count - the number of non-empty cells included in the selection. It's an equivalent of the COUNTA function.
- Sum - if the selected cells contain numerical values, the status bar presents the sum of those values, providing a quick way to calculate the total without using the Excel SUM formula.
- Average - when working with numeric data, the average (mean) value of the selected cells is displayed, giving you a sense of the data's central tendency. It's an analogue of the AVERAGE function.

In addition to the default statistical / mathematical options, a customized status bar can provide a broader range of calculations for the selected range:
- Numerical count - displays the number of numeric values within the selected range, equivalent to using a COUNT formula.
- Minimum - find the lowest value in the selected subset, just like the MIN function.
- Maximum - get the highest values within the selected range, similar to using the MAX function.

By activating these additional status bar options, you can perform basic data analysis without the need for dedicated functions.
Please keep in mind that in case the selection only contains text values, the status bar shows only the count of the selected non-blank cells. If average and sum are not displayed for numeric values, you can find possible causes and solutions in this article: Why Excel is not displaying average/sum in status bar.
How to copy sum from Excel status bar
To copy sum, average, count, or any other statistics from the Excel status bar, follow these steps:
- Copy the status bar value to clipboard. For this, simply click on the value you want in the status bar.
- Paste the copied value. Navigate to the target location in your spreadsheet or another application and use the keyboard shortcut Ctrl V to paste the copied value. In Excel, you can also right-click the cell and choose Paste from the context menu.
For example, this is how you can copy sum from the status bar into a selected cell:

Similarly, you can copy any other status bar value and paste it wherever needed. This is a quick way to extract and utilize the statistics provided by the status bar in different parts of your spreadsheet or other applications.
Beyond status bar basics
The status bar in Excel offers more than just basic information and calculations. It holds a few hidden gems that are not immediately noticeable but can be very helpful when dealing with specific tasks. Let's explore some of these status bar's little-known secrets.
Number of Flash Fill changed cells
One of the remarkable features in Excel is Flash Fill, which intelligently recognizes patterns and automatically fills adjacent cells accordingly. The status bar keeps you informed of the applied Flash Fill operation, helping you ensure the desired data transformation has been accurately applied.

Number of filtered rows
When you apply a filter to a table or range of data in Excel, the status bar displays the number of visible rows. This handy feature lets you keep track of the records that meet the applied filter criteria, aiding in understanding the filtered subset of data.

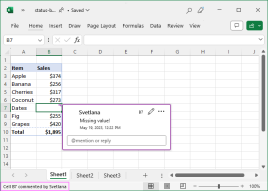
Comment author
Collaborative work in Excel often involves adding comments to specific cells to provide additional context or instructions. The status bar takes it a step further by showing the name of the person who has commented on a particular cell. This helps identify the contributors, making it easier to follow up or seek clarification when needed.
As you see, these hidden features of the status bar go beyond its usual functions, adding convenience and efficiency to your Excel experience.
In conclusion, the status bar in Excel is a versatile and powerful tool. By providing real-time calculations, essential statistics, and customization options to suit your preferences and working style, it proves to be an indispensable companion in your Excel journey. So, next time you open your workbooks, pay attention to the status bar and unlock its full potential to excel in your data management endeavors.
The above is the detailed content of Status bar in Excel: how to customize and use. For more information, please follow other related articles on the PHP Chinese website!

 MEDIAN formula in Excel - practical examplesApr 11, 2025 pm 12:08 PM
This tutorial explains how to calculate the median of numerical data in Excel using the MEDIAN function. The median, a key measure of central tendency, identifies the middle value in a dataset, offering a more robust representation of central tenden
 Google Spreadsheet COUNTIF function with formula examplesApr 11, 2025 pm 12:03 PM
Master Google Sheets COUNTIF: A Comprehensive Guide This guide explores the versatile COUNTIF function in Google Sheets, demonstrating its applications beyond simple cell counting. We'll cover various scenarios, from exact and partial matches to han
 Excel shared workbook: How to share Excel file for multiple usersApr 11, 2025 am 11:58 AM
This tutorial provides a comprehensive guide to sharing Excel workbooks, covering various methods, access control, and conflict resolution. Modern Excel versions (2010, 2013, 2016, and later) simplify collaborative editing, eliminating the need to m
 How to convert Excel to JPG - save .xls or .xlsx as image fileApr 11, 2025 am 11:31 AM
This tutorial explores various methods for converting .xls files to .jpg images, encompassing both built-in Windows tools and free online converters. Need to create a presentation, share spreadsheet data securely, or design a document? Converting yo
 Excel names and named ranges: how to define and use in formulasApr 11, 2025 am 11:13 AM
This tutorial clarifies the function of Excel names and demonstrates how to define names for cells, ranges, constants, or formulas. It also covers editing, filtering, and deleting defined names. Excel names, while incredibly useful, are often overlo
 Standard deviation Excel: functions and formula examplesApr 11, 2025 am 11:01 AM
This tutorial clarifies the distinction between standard deviation and standard error of the mean, guiding you on the optimal Excel functions for standard deviation calculations. In descriptive statistics, the mean and standard deviation are intrinsi
 Square root in Excel: SQRT function and other waysApr 11, 2025 am 10:34 AM
This Excel tutorial demonstrates how to calculate square roots and nth roots. Finding the square root is a common mathematical operation, and Excel offers several methods. Methods for Calculating Square Roots in Excel: Using the SQRT Function: The
 Google Sheets basics: Learn how to work with Google SpreadsheetsApr 11, 2025 am 10:23 AM
Unlock the Power of Google Sheets: A Beginner's Guide This tutorial introduces the fundamentals of Google Sheets, a powerful and versatile alternative to MS Excel. Learn how to effortlessly manage spreadsheets, leverage key features, and collaborate


Hot AI Tools

Undresser.AI Undress
AI-powered app for creating realistic nude photos

AI Clothes Remover
Online AI tool for removing clothes from photos.

Undress AI Tool
Undress images for free

Clothoff.io
AI clothes remover

AI Hentai Generator
Generate AI Hentai for free.

Hot Article
Hot Tools

SAP NetWeaver Server Adapter for Eclipse
Integrate Eclipse with SAP NetWeaver application server.

PhpStorm Mac version
The latest (2018.2.1) professional PHP integrated development tool

Safe Exam Browser
Safe Exam Browser is a secure browser environment for taking online exams securely. This software turns any computer into a secure workstation. It controls access to any utility and prevents students from using unauthorized resources.

Dreamweaver Mac version
Visual web development tools

MinGW - Minimalist GNU for Windows
This project is in the process of being migrated to osdn.net/projects/mingw, you can continue to follow us there. MinGW: A native Windows port of the GNU Compiler Collection (GCC), freely distributable import libraries and header files for building native Windows applications; includes extensions to the MSVC runtime to support C99 functionality. All MinGW software can run on 64-bit Windows platforms.

