


Key Takeaways
- The Webix framework can be used in combination with the open-source JavaScript Gantt chart dhtmlxGantt to create a custom Gantt chart application. This combination allows for the visualization of a project’s working process and offers features such as export and customizable time scale.
- The creation of a basic Gantt chart involves downloading the dhtmlxGantt library package and extracting the “codebase” folder to the project directory. The chart can then be initialized with data, including tasks and links, represented as JavaScript objects.
- Webix UI components can be used to add further control to the Gantt chart. For example, a menu button can be added to allow for the export of the chart into different file formats, and a toolbar can be included to allow for the changing of the chart’s scale.
- The final product is a lightweight online chart creation tool, which has the potential for extensive functionality. The source code and a demo of the chart can be found on GitHub.
In my previous article, I’ve introduced you the Webix Framework. You’ve discovered its basic features and learned how to create a very good-looking responsive web application with it. Now it’s time to take a little step forward and see what else we can do with this promising framework.
In this article, I’ll show you how to create your own Gantt chart application and to complete this task I’ll use the Webix framework in combination with an open source JavaScript Gantt chart called dhtmlxGantt.
But why the Gantt chart, you might ask. Well, undoubtedly it has many pros. Firstly, these charts are widely used to visualize the working process of a project due to their intuitive way of representation. Secondly, dhtmlxGantt is a Gantt chart tool which has a big list of features such as export, customizable time scale, and so on. Finally, I found a post titled DHTMLX Gantt Chart in Webix Web Apps in the Webix developer’s blog and it turned out that you can add a Gantt chart into a Webix application with just few lines of code. So, I thought that they could fit well together.
If you might need help, a bunch of step-by-step guides are available as well, so feel free to use them if in doubt.
Creating a Basic Gantt Chart
Let’s now create our application. First, we’ll take a look at a basic chart. Then, we’ll add some features to increase its functionality.
Preparing the Files
First of all, we need to download the dhtmlxGantt library package and extract the “codebase” folder to the project directory. Since the ntegration with dhtmlxGantt isn’t a built-in Webix feature, we need to download required files from this GitHub repository. We are interested in is the “gantt” directory that you should place into your project directory.
I’ve used the Webix CDN to include Webix to my project, but you can download the full library if you want. Moreover, we need the api.js file which will allow us to use the export feature.
So, here’s my index.html file at the moment:
<span><span><span>></span>
</span>   <span><span><span><title>></title></span>Webix Gantt Chart<span><span></span>></span>
</span>   <span><!--Webix-->
</span>   <span><span><span><script> src<span >="http://cdn.webix.com/edge/webix.js"</script></span>></span><span><span></span>></span>
</span>   <span><span><span><link> rel<span>="stylesheet"</span> href<span>="http://cdn.webix.com/edge/webix.css"</span> /></span>
</span>   <span><!--dhtmlxGantt-->
</span>   <span><span><span><script> src<span >="codebase/dhtmlxgantt.js"</script></span>></span><span><span></span>></span>
</span>   <span><span><span><link> href<span>="codebase/dhtmlxgantt.css"</span> rel<span>="stylesheet"</span> /></span>
</span>   <span><!--dhtmlxGantt integration-->
</span>   <span><span><span><script> type<span >="text/javascript"</script></span> src<span>="./gantt/gantt.js"</span>></span><span><span></span>></span>
</span>   <span><!--export-->
</span>   <span><span><span><script> src<span >="http://export.dhtmlx.com/gantt/api.js"</script></span>></span><span><span></span>></span>
</span><span><span><span></span>></span></span></span></span></span></span>
Once done, we can create a basic Gantt chart.
Gantt Chart Initialization
This chart offers the possibility to use a database to store the data (you can check the documentation page to see how it works). However, for our experiment we’ll use inline data as an example to focus on the JavaScript part. n this tutorial I’ll pretend the use of the second one whose content has also been converted into its equivalent JavaScript object:
<span>var tasks = {
</span>   <span>data: [{
</span>         <span>id: 1,
</span>         <span>text: "Project #1",
</span>         <span>start_date: "01-06-2015",
</span>         <span>duration: 11,
</span>         <span>progress: 0.6,
</span>         <span>open: true
</span>      <span>}, {
</span>         <span>id: 2,
</span>         <span>text: "Task #1",
</span>         <span>start_date: "03-06-2015",
</span>         <span>duration: 5,
</span>         <span>progress: 1,
</span>         <span>open: true,
</span>         <span>parent: 1
</span>      <span>},
</span>      <span>/*some more tasks*/
</span>      <span>{
</span>         <span>id: 6,
</span>         <span>text: "Task #2.3",
</span>         <span>start_date: "05-06-2015",
</span>         <span>duration: 4,
</span>         <span>progress: 0.2,
</span>         <span>open: true,
</span>         <span>parent: 3
</span>      <span>}
</span>   <span>],
</span>   <span>links: [{
</span>         <span>id: 1,
</span>         <span>source: 1,
</span>         <span>target: 2,
</span>         <span>type: "1"
</span>      <span>}, {
</span>         <span>id: 2,
</span>         <span>source: 1,
</span>         <span>target: 3,
</span>         <span>type: "1"
</span>      <span>},
</span>      <span>/*some more links*/
</span>      <span>{
</span>         <span>id: 5,
</span>         <span>source: 5,
</span>         <span>target: 6,
</span>         <span>type: "0"
</span>      <span>}
</span>   <span>]
</span><span>};</span>
Let’s discuss the properties. The dataproperty contains the tasks description: the task name, its ID, its starting date, the task duration presented in the units of the current time scale (days by default), and the current progress (a number ranging from 0 to 1). It also includes the open property which defines whether the task branch is open or not, and the parent property, whose aim is to define the parent task. The links parameter defines dependency links and it consists of the following values: the task ID, the source task that depends on the target one and, the dependency type (0 – ‘finish to start’, 1 – ‘start to start’, 2 – ‘finish to finish’).
We can now initialize our chart with this data:
webix<span>.ui({
</span>   <span>rows: [
</span>      <span>//row_1: header
</span>      <span>{
</span>         <span>type: "header",
</span>         <span>template: "Webix Gantt Chart"
</span>      <span>},
</span>      <span>//row_2: gantt chart
</span>      <span>{
</span>         <span>view: "dhx-gantt",
</span>         <span>init: function() {
</span>            gantt<span>.config.order_branch = true;
</span>         <span>},
</span>         <span>ready: function() {
</span>            gantt<span>.parse(tasks);
</span>         <span>}
</span>      <span>}
</span>   <span>]
</span><span>});</span>
The view:"dhx-gantt" defines a UI component type, Gantt chart in this case. The init property contains the function which will run before the initialization. I’ve used the order_branch option to enable drag-and-drop tasks reordering. The ready property defines the function which is triggered when the component is fully loaded. In our case, it initializes the chart with previously created data using the gantt.parse() method.
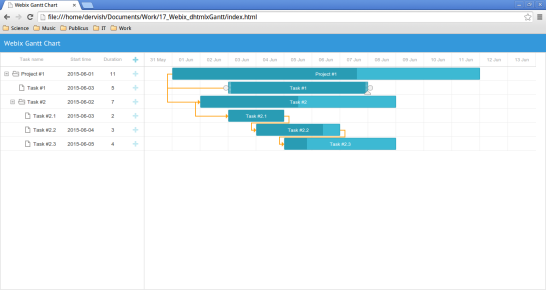
The result is shown below:
So, which features do we have? You can redefine the existing task dependencies and create new ones. You can do it by dragging circles at the edges of the tasks. The progress status can be changed with the triangle at the bottom. The start time of a task can be changed by means of dragging a task in the horizontal direction. As for duration, you can set it by resizing the task. We can add new tasks and subtasks using the “ ” buttons.
Here’s how a new task creation looks like:

At this point we can create a chart, but there are no ways to manipulate it. So, let’s add some controls for this purpose.
More Control with Webix
We’ll use some of the Webix UI components to control our chart.
“Export to…” Menu Button
To avoid messy code, I’ve decided to separate the UI components initialization from the layout code.
Firstly, let’s define the menu button, which will allow us to export our chart into different file formats. For this purpose, we’ll use the Webix Menu component.
Here’s the menu description:
<span><span><span>></span>
</span>   <span><span><span><title>></title></span>Webix Gantt Chart<span><span></span>></span>
</span>   <span><!--Webix-->
</span>   <span><span><span><script> src<span >="http://cdn.webix.com/edge/webix.js"</script></span>></span><span><span></span>></span>
</span>   <span><span><span><link> rel<span>="stylesheet"</span> href<span>="http://cdn.webix.com/edge/webix.css"</span> /></span>
</span>   <span><!--dhtmlxGantt-->
</span>   <span><span><span><script> src<span >="codebase/dhtmlxgantt.js"</script></span>></span><span><span></span>></span>
</span>   <span><span><span><link> href<span>="codebase/dhtmlxgantt.css"</span> rel<span>="stylesheet"</span> /></span>
</span>   <span><!--dhtmlxGantt integration-->
</span>   <span><span><span><script> type<span >="text/javascript"</script></span> src<span>="./gantt/gantt.js"</span>></span><span><span></span>></span>
</span>   <span><!--export-->
</span>   <span><span><span><script> src<span >="http://export.dhtmlx.com/gantt/api.js"</script></span>></span><span><span></span>></span>
</span><span><span><span></span>></span></span></span></span></span></span>
By default, the menu button is activated when the mouse hovers over it. The openAction: "click" property redefines this behavior, so the menu will open its submenus by the mouse click only. The data parameter defines the menu content. What’s interesting here is the type: "icon" property which allows us to add an icon to the menu button. Webix uses Font Awesome icons collection. If you want to apply the icon you like, you have to use the icon’s name as the value of the icon parameter.
The next step is the event handling. The onItemClick event fires when one of the menu items is clicked. I’ve used the switch statement to handle the selected id value, so you can see what method is used for a certain file format. The submenu parameter contains the menu items definition.
Toolbar
We’ll place our toolbar at the bottom of the page. It’ll contain the control elements including our menu button.
The Toolbar component will help us with that. But before, let’s define which options we should add. If you want to manage a project the duration of which is long enough, you should think about the scale changing feature. dhtmlxGantt provides you with a wide variety of available scale properties. We’ll use Day, Week, and Month scales.
Let’s define the function that will enable the month scale:
<span>var tasks = {
</span>   <span>data: [{
</span>         <span>id: 1,
</span>         <span>text: "Project #1",
</span>         <span>start_date: "01-06-2015",
</span>         <span>duration: 11,
</span>         <span>progress: 0.6,
</span>         <span>open: true
</span>      <span>}, {
</span>         <span>id: 2,
</span>         <span>text: "Task #1",
</span>         <span>start_date: "03-06-2015",
</span>         <span>duration: 5,
</span>         <span>progress: 1,
</span>         <span>open: true,
</span>         <span>parent: 1
</span>      <span>},
</span>      <span>/*some more tasks*/
</span>      <span>{
</span>         <span>id: 6,
</span>         <span>text: "Task #2.3",
</span>         <span>start_date: "05-06-2015",
</span>         <span>duration: 4,
</span>         <span>progress: 0.2,
</span>         <span>open: true,
</span>         <span>parent: 3
</span>      <span>}
</span>   <span>],
</span>   <span>links: [{
</span>         <span>id: 1,
</span>         <span>source: 1,
</span>         <span>target: 2,
</span>         <span>type: "1"
</span>      <span>}, {
</span>         <span>id: 2,
</span>         <span>source: 1,
</span>         <span>target: 3,
</span>         <span>type: "1"
</span>      <span>},
</span>      <span>/*some more links*/
</span>      <span>{
</span>         <span>id: 5,
</span>         <span>source: 5,
</span>         <span>target: 6,
</span>         <span>type: "0"
</span>      <span>}
</span>   <span>]
</span><span>};</span>
The scale_unit property defines the scale unit. Its possible values are “minute”, “hour”, “day”, “week”, “quarter”, “month”, and “year”. To set a proper format of the time scale we’ve used the date_scale property. After that we should refresh the chart with gantt.parse(tasks).
Here’s how our chart looks like after we’ve used this function:
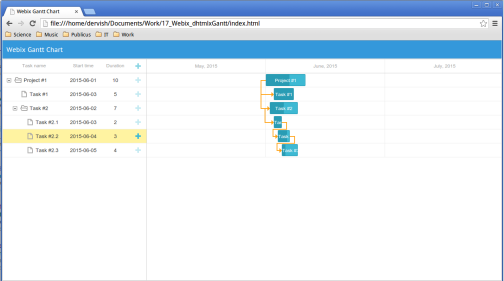
Other scale functions work pretty in a similar fashion, so I won’t describe them.
Now we can define the toolbar variable:
<span><span><span>></span>
</span>   <span><span><span><title>></title></span>Webix Gantt Chart<span><span></span>></span>
</span>   <span><!--Webix-->
</span>   <span><span><span><script> src<span >="http://cdn.webix.com/edge/webix.js"</script></span>></span><span><span></span>></span>
</span>   <span><span><span><link> rel<span>="stylesheet"</span> href<span>="http://cdn.webix.com/edge/webix.css"</span> /></span>
</span>   <span><!--dhtmlxGantt-->
</span>   <span><span><span><script> src<span >="codebase/dhtmlxgantt.js"</script></span>></span><span><span></span>></span>
</span>   <span><span><span><link> href<span>="codebase/dhtmlxgantt.css"</span> rel<span>="stylesheet"</span> /></span>
</span>   <span><!--dhtmlxGantt integration-->
</span>   <span><span><span><script> type<span >="text/javascript"</script></span> src<span>="./gantt/gantt.js"</span>></span><span><span></span>></span>
</span>   <span><!--export-->
</span>   <span><span><span><script> src<span >="http://export.dhtmlx.com/gantt/api.js"</script></span>></span><span><span></span>></span>
</span><span><span><span></span>></span></span></span></span></span></span>
It looks similar to our previously created menu. The paddingY property sets the top and bottom padding values to 0. The elements property defines the toolbar content, just as the data property in our menu example. Toolbar’s first element is our menu while the second one is a Segmented Button. It’s useful when you want to switch between the available values like the scale units in our example. One more event handler was used to manage the user’s choice, but this time it’s the onChange event. It fires after the currently selected button is changed. Our previously defined functions will change the scale according to the selected button ID. The option property defines the buttons (segments) within the control.
Finally, it’s time to add the toolbar to our chart. To do this, just add the toolbar variable to your layout code:
<span>var tasks = {
</span>   <span>data: [{
</span>         <span>id: 1,
</span>         <span>text: "Project #1",
</span>         <span>start_date: "01-06-2015",
</span>         <span>duration: 11,
</span>         <span>progress: 0.6,
</span>         <span>open: true
</span>      <span>}, {
</span>         <span>id: 2,
</span>         <span>text: "Task #1",
</span>         <span>start_date: "03-06-2015",
</span>         <span>duration: 5,
</span>         <span>progress: 1,
</span>         <span>open: true,
</span>         <span>parent: 1
</span>      <span>},
</span>      <span>/*some more tasks*/
</span>      <span>{
</span>         <span>id: 6,
</span>         <span>text: "Task #2.3",
</span>         <span>start_date: "05-06-2015",
</span>         <span>duration: 4,
</span>         <span>progress: 0.2,
</span>         <span>open: true,
</span>         <span>parent: 3
</span>      <span>}
</span>   <span>],
</span>   <span>links: [{
</span>         <span>id: 1,
</span>         <span>source: 1,
</span>         <span>target: 2,
</span>         <span>type: "1"
</span>      <span>}, {
</span>         <span>id: 2,
</span>         <span>source: 1,
</span>         <span>target: 3,
</span>         <span>type: "1"
</span>      <span>},
</span>      <span>/*some more links*/
</span>      <span>{
</span>         <span>id: 5,
</span>         <span>source: 5,
</span>         <span>target: 6,
</span>         <span>type: "0"
</span>      <span>}
</span>   <span>]
</span><span>};</span>
Here’s the result:

Our chart is scalable now. Menu icons will help a user to make his choice.
Conclusions
In this article we’ve seen how to build a dhtmlxGantt based Gantt chart app, set a proper scale according to its overall duration, and export it to a file for further needs. What we’ve got is a lightweight online chart creation tool.
There are just a couple of articles about the integration of Webix with dhtmlxGantt at the moment. However, according to this post titled Use case of Webix UI – Gantt PRO, recently Webix has been used to create GanttPRO – an advanced online Gantt chart app. This makes me guess that, by using the features and UI components described in the post, you’ll be able to considerably extend Gantt chart functionality.
If you want to check out the source code and a demo, you can visit this GitHub page.
Frequently Asked Questions (FAQs) about Creating Your Own Gantt Chart with Webix
How can I customize the appearance of my Gantt chart in Webix?
Webix provides a variety of customization options for your Gantt chart. You can change the color, size, and style of the bars, text, and grid lines. You can also add labels, tooltips, and legends. To customize the appearance, you need to modify the properties of the Gantt chart object in your JavaScript code. For example, to change the color of the bars, you can use the ‘color’ property. You can also use CSS to further customize the appearance of your Gantt chart.
Can I add dependencies between tasks in my Gantt chart?
Yes, you can add dependencies between tasks in your Gantt chart in Webix. Dependencies are represented by lines connecting the bars of the tasks. To add a dependency, you need to specify the ‘depends_on’ property for a task in your data. The value of this property should be the id of the task that it depends on. This will automatically draw a line from the dependent task to the task it depends on.
How can I handle large amounts of data in my Gantt chart?
Webix provides several features to handle large amounts of data in your Gantt chart. You can use the ‘paging’ feature to divide your data into pages. This allows you to display a manageable amount of data at a time. You can also use the ‘filtering’ feature to display only the data that meets certain criteria. This can be useful if you want to focus on specific tasks.
Can I export my Gantt chart to a PDF or image file?
Yes, you can export your Gantt chart to a PDF or image file in Webix. This can be useful if you want to share your chart with others or include it in a report. To export your chart, you need to use the ‘exportToPDF’ or ‘exportToPNG’ method of the Gantt chart object. This will generate a PDF or PNG file of your chart that you can download.
How can I add interactivity to my Gantt chart?
Webix provides several features to add interactivity to your Gantt chart. You can add event listeners to respond to user actions such as clicking or dragging a bar. You can also use the ‘editable’ property to allow users to edit the tasks directly in the chart. This can be useful if you want to allow users to update the progress of tasks.
Can I use Webix to create a Gantt chart in a mobile app?
Yes, you can use Webix to create a Gantt chart in a mobile app. Webix is a JavaScript library, so it can be used in any platform that supports JavaScript. This includes mobile platforms such as iOS and Android. The Gantt chart will automatically adapt to the screen size of the device.
How can I add milestones to my Gantt chart?
You can add milestones to your Gantt chart in Webix by creating tasks with a duration of zero. These tasks will be displayed as diamonds in the chart. To create a milestone, you need to specify the ‘start_date’ and ‘end_date’ properties of a task to be the same. This will create a task with a duration of zero, which will be displayed as a milestone.
Can I use Webix to create a Gantt chart with multiple timelines?
Yes, you can use Webix to create a Gantt chart with multiple timelines. This can be useful if you want to display different levels of detail or different aspects of your project. To create multiple timelines, you need to use the ‘subtasks’ property of a task. This allows you to create a hierarchy of tasks, each with its own timeline.
How can I add resources to my Gantt chart?
You can add resources to your Gantt chart in Webix by creating tasks with a ‘resource’ property. This property should be an object that contains the details of the resource, such as its name and capacity. The resource will be displayed in the chart as a label next to the task.
Can I use Webix to create a Gantt chart in a web application?
Yes, you can use Webix to create a Gantt chart in a web application. Webix is a JavaScript library, so it can be used in any platform that supports JavaScript. This includes web platforms such as HTML5 and CSS3. The Gantt chart will automatically adapt to the screen size of the device.
The above is the detailed content of Making your own Gantt chart with Webix. For more information, please follow other related articles on the PHP Chinese website!

 JavaScript Engines: Comparing ImplementationsApr 13, 2025 am 12:05 AM
Different JavaScript engines have different effects when parsing and executing JavaScript code, because the implementation principles and optimization strategies of each engine differ. 1. Lexical analysis: convert source code into lexical unit. 2. Grammar analysis: Generate an abstract syntax tree. 3. Optimization and compilation: Generate machine code through the JIT compiler. 4. Execute: Run the machine code. V8 engine optimizes through instant compilation and hidden class, SpiderMonkey uses a type inference system, resulting in different performance performance on the same code.
 Beyond the Browser: JavaScript in the Real WorldApr 12, 2025 am 12:06 AM
JavaScript's applications in the real world include server-side programming, mobile application development and Internet of Things control: 1. Server-side programming is realized through Node.js, suitable for high concurrent request processing. 2. Mobile application development is carried out through ReactNative and supports cross-platform deployment. 3. Used for IoT device control through Johnny-Five library, suitable for hardware interaction.
 Building a Multi-Tenant SaaS Application with Next.js (Backend Integration)Apr 11, 2025 am 08:23 AM
I built a functional multi-tenant SaaS application (an EdTech app) with your everyday tech tool and you can do the same. First, what’s a multi-tenant SaaS application? Multi-tenant SaaS applications let you serve multiple customers from a sing
 How to Build a Multi-Tenant SaaS Application with Next.js (Frontend Integration)Apr 11, 2025 am 08:22 AM
This article demonstrates frontend integration with a backend secured by Permit, building a functional EdTech SaaS application using Next.js. The frontend fetches user permissions to control UI visibility and ensures API requests adhere to role-base
 JavaScript: Exploring the Versatility of a Web LanguageApr 11, 2025 am 12:01 AM
JavaScript is the core language of modern web development and is widely used for its diversity and flexibility. 1) Front-end development: build dynamic web pages and single-page applications through DOM operations and modern frameworks (such as React, Vue.js, Angular). 2) Server-side development: Node.js uses a non-blocking I/O model to handle high concurrency and real-time applications. 3) Mobile and desktop application development: cross-platform development is realized through ReactNative and Electron to improve development efficiency.
 The Evolution of JavaScript: Current Trends and Future ProspectsApr 10, 2025 am 09:33 AM
The latest trends in JavaScript include the rise of TypeScript, the popularity of modern frameworks and libraries, and the application of WebAssembly. Future prospects cover more powerful type systems, the development of server-side JavaScript, the expansion of artificial intelligence and machine learning, and the potential of IoT and edge computing.
 Demystifying JavaScript: What It Does and Why It MattersApr 09, 2025 am 12:07 AM
JavaScript is the cornerstone of modern web development, and its main functions include event-driven programming, dynamic content generation and asynchronous programming. 1) Event-driven programming allows web pages to change dynamically according to user operations. 2) Dynamic content generation allows page content to be adjusted according to conditions. 3) Asynchronous programming ensures that the user interface is not blocked. JavaScript is widely used in web interaction, single-page application and server-side development, greatly improving the flexibility of user experience and cross-platform development.
 Is Python or JavaScript better?Apr 06, 2025 am 12:14 AM
Python is more suitable for data science and machine learning, while JavaScript is more suitable for front-end and full-stack development. 1. Python is known for its concise syntax and rich library ecosystem, and is suitable for data analysis and web development. 2. JavaScript is the core of front-end development. Node.js supports server-side programming and is suitable for full-stack development.


Hot AI Tools

Undresser.AI Undress
AI-powered app for creating realistic nude photos

AI Clothes Remover
Online AI tool for removing clothes from photos.

Undress AI Tool
Undress images for free

Clothoff.io
AI clothes remover

AI Hentai Generator
Generate AI Hentai for free.

Hot Article
Hot Tools

MantisBT
Mantis is an easy-to-deploy web-based defect tracking tool designed to aid in product defect tracking. It requires PHP, MySQL and a web server. Check out our demo and hosting services.

MinGW - Minimalist GNU for Windows
This project is in the process of being migrated to osdn.net/projects/mingw, you can continue to follow us there. MinGW: A native Windows port of the GNU Compiler Collection (GCC), freely distributable import libraries and header files for building native Windows applications; includes extensions to the MSVC runtime to support C99 functionality. All MinGW software can run on 64-bit Windows platforms.

ZendStudio 13.5.1 Mac
Powerful PHP integrated development environment

EditPlus Chinese cracked version
Small size, syntax highlighting, does not support code prompt function

Zend Studio 13.0.1
Powerful PHP integrated development environment

