

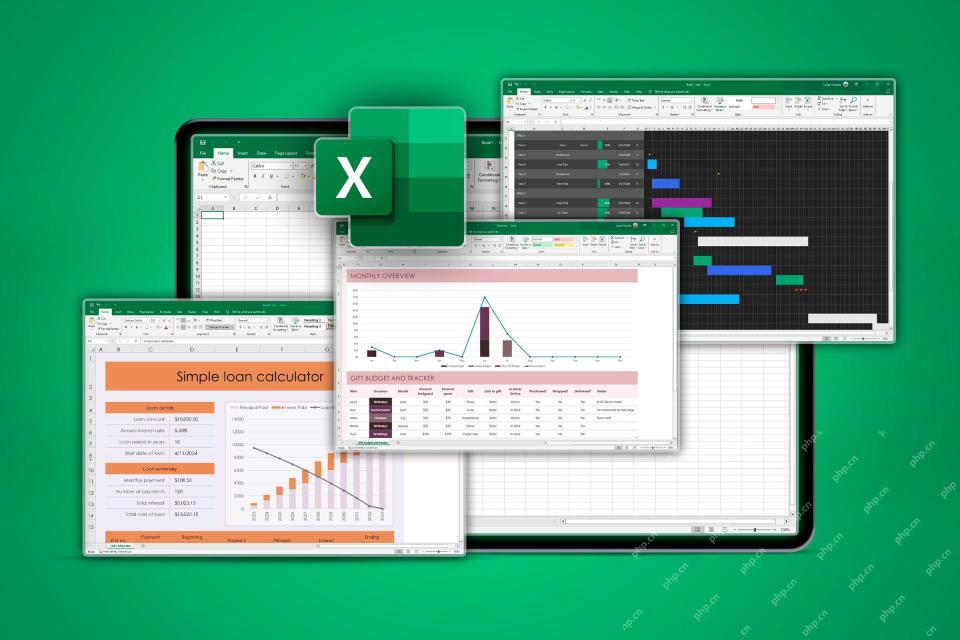
 Software TutorialOffice SoftwareUsing the Free Version of Excel? You're Missing These 5 Features
Microsoft Excel Online has limited functionality and lacks advanced formulas and charts compared to paid versions. Powerful data analytics tools such as Power Query and Power Pivot are available only in Microsoft 365 subscriptions. Desktop Excel provides more features, better offline experience, higher reliability and more powerful automation capabilities.
The full-featured Microsoft Excel remains the leader in spreadsheets. While the free online version of Excel is suitable for many use cases, it has some key limitations compared to the desktop version.
If you are a business user, or a power user who wants to automate home data tasks such as balancing budgets, or want to get involved in data analytics, you will miss a lot of advanced features (old and new) that are only available in paid versions of Excel Both).
Advanced Formulas and Charts

Free Version Microsoft Excel allows you to use only limited formulas and charts that have powered commercial applications for decades and added a lot of color to presentations. Some of the formulas and charts you miss can unlock some very impressive use cases such as XLOOKUP(), UNIQUE(), LET(), FILTER(), and LAMBDA() (the latter allows you to define your own reusable functions ! ).
We can't forget the pivot tables used to summarize and help you analyze your data. It may be the key Excel feature (at least historically), while the free version of Excel only supports basic pivot table features.
Power Query, Power Pivot and Data Analysis Tools
Excel has been expanded with new tools to meet new data analytics needs. Power Query provides ETL (extract, transform, load) capabilities, which are critical for big data use cases, while Power Pivot provides tools to create complex relationships between data, allowing for deeper analysis. Power Query has limited functionality in the free online version of Excel, and Power Pivot is completely missing.
Offline usage and reliability

Desktop applications are arguably still providing a better user experience than browser-based applications. You can work anywhere, even if your internet connection is not in good condition or no internet connection, perfect for digital nomads, and despite a huge leap in performance for browser-based applications, desktop applications (including Excel) Still has huge performance and functional advantages.
In addition to being more powerful and easier to use, desktop applications also allow you to save data on your own devices. This means there is no limit on the amount of data you want to process, no privacy and security issues for your data (very important for businesses in the era of GDPR, CCPA, and HIPAA). Processing local data also gives you control over the data, allowing you to back up and manage your own data without being affected by cloud storage errors that may cause data to be inaccessible.
Macro and automation

Excel allows you to record macros to play back your actions (repeat the options and keys you recorded) and create Office scripts for automation (although Office scripts are available in Excel Online, you need to pay to use Microsoft 365). In desktop Excel, you can also access more advanced developer and automation features through VBA (Visual Basic for Applications).
Those who have some experience with Excel may feel uncomfortable when they mention VBA, but they will admit that it is still a powerful tool if you know how to use it. VBA allows you to create custom interfaces to take advantage of automation in Excel, and while it is an ugly language that can be difficult to learn, and uses a less intuitive editor, it allows you to do a lot and is worth overcoming. obstacle. One recent improvement is that AI tools for Excel automation and VBA can help you write scripts.
It is always worth pointing out that Microsoft Office macros can pose a network security risk, so you should only open the macro-enabled documents from trusted sources and proofread any code you find online before running.
More data from more places

With desktop version of Microsoft Excel, you can read raw data from CSV files directly from local disk or network (no upload required), allowing you to process large amounts of data. You can also connect to a database server, load data from a JSON format API, or even crawl data from a web page.
Ability to access data from these sources allows you to get data from a large number of analytics and other sources, process it using other tools such as Python, and then continue to improve it in Excel. Plug-ins for desktop Excel are also available for integration with other data sources and tools.
Microsoft Excel still dominates the business world (for better or worse)
Excel has been around for a long time, it is still prevalent in business and education, and despite the increasing competition from new tools, it still manages to thrive in new data analytics use cases. Although some parts have become a little stale and some puzzling UI selection and functionality have lasted for decades (no doubt for compatibility and satisfying deeply rooted users), many still think it is what it does. The best tool (and it's still improving).
If you don't agree with its features, or if you don't use spreadsheets for a reasonable price for a Microsoft 365 subscription, check out our list of Microsoft Excel alternatives, or our best free apps for replacing Microsoft 365 and Adobe subscriptions Program Guide.
The above is the detailed content of Using the Free Version of Excel? You're Missing These 5 Features. For more information, please follow other related articles on the PHP Chinese website!

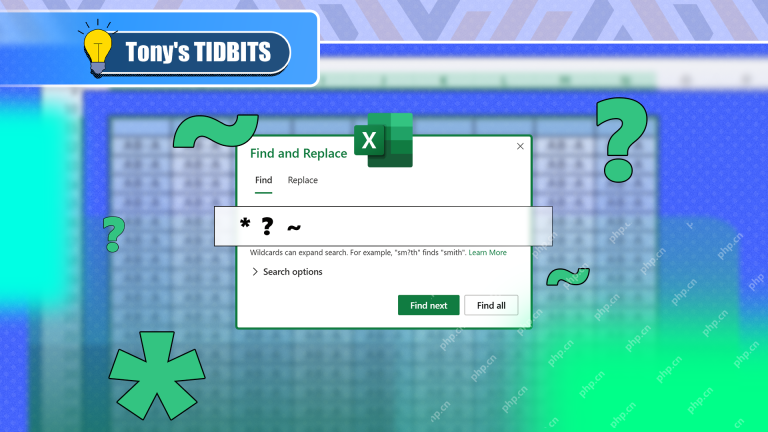 How You Can Use Wildcards in Microsoft Excel to Refine Your SearchMay 13, 2025 am 01:59 AM
Excel wildcards: a powerful tool for efficient search and filtering This article will dive into the power of wildcards in Microsoft Excel, including their application in search, formulas, and filters, and some details to note. Wildcards allow you to perform fuzzy matching, making it more flexible to find and process data. *Wildcards: asterisks () and question marks (?)** Excel mainly uses two wildcards: asterisk (*) and question mark (?). *Asterisk (): Any number of characters** The asterisk represents any number of characters, including zero characters. For example: *OK* Match the cell containing "OK", "OK&q
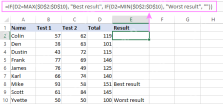 Excel IF function with multiple conditionsMay 12, 2025 am 11:02 AM
The tutorial shows how to create multiple IF statements in Excel with AND as well as OR logic. Also, you will learn how to use IF together with other Excel functions. In the first part of our Excel IF tutorial, we looked at how to constru
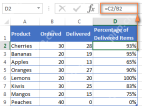 How to calculate percentage in Excel - formula examplesMay 12, 2025 am 10:28 AM
In this tutorial, you will lean a quick way to calculate percentages in Excel, find the basic percentage formula and a few more formulas for calculating percentage increase, percent of total and more. Calculating percentage is useful in m
 Logical operators in Excel: equal to, not equal to, greater than, less thanMay 12, 2025 am 09:41 AM
Logical operators in Excel: The key to efficient data analysis In Excel, many tasks involve comparing data in different cells. To this end, Microsoft Excel provides six logical operators, also known as comparison operators. This tutorial is designed to help you understand the connotation of Excel logical operators and write the most efficient formulas for data analysis. Excel logical operators equal Not equal to Greater than/less than/greater than/six equal to/less than equal to Common uses of logical operators in Excel Overview of Excel Logical Operators Logical operators in Excel are used to compare two values. Logical operators are sometimes called boolean operators because in any given case, the result of comparison
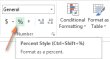 How to show percentage in ExcelMay 12, 2025 am 09:40 AM
This concise guide explores Excel's percentage formatting capabilities, covering various scenarios and advanced techniques. Learn how to format existing values, handle empty cells, and customize your percentage display. To quickly apply percentage f
 Logical functions in Excel: AND, OR, XOR and NOTMay 12, 2025 am 09:39 AM
The tutorial explains the essence of Excel logical functions AND, OR, XOR and NOT and provides formula examples that demonstrate their common and inventive uses. Last week we tapped into the insight of Excel logical operators that are us
 Comments vs. Notes in Microsoft Excel: What's the Difference?May 12, 2025 am 06:03 AM
This guide explores Microsoft Excel's comment and note features, explaining their uses and differences. Both tools annotate cells, but serve distinct purposes and display differently in printed worksheets. Excel Comments: Collaborative Annotations E
 Excel templates: how to make and useMay 11, 2025 am 10:43 AM
Excel template: a tool for efficient office work Microsoft Excel templates are a powerful tool to improve the efficiency of Excel, saving significantly time. After creating a template, you only need a small amount of adjustment to adapt to different scenarios and achieve reuse. Well-designed Excel templates can also improve the aesthetics and consistency of documents, leaving a good impression on colleagues and bosses. The value of templates is particularly prominent for common document types such as calendars, budget planners, invoices, inventory tables, and dashboards. What else is more convenient than just using a spreadsheet that looks beautiful, has a full-featured and is easy to customize? A Microsoft Excel template is a pre-designed workbook or worksheet, most of which


Hot AI Tools

Undresser.AI Undress
AI-powered app for creating realistic nude photos

AI Clothes Remover
Online AI tool for removing clothes from photos.

Undress AI Tool
Undress images for free

Clothoff.io
AI clothes remover

Video Face Swap
Swap faces in any video effortlessly with our completely free AI face swap tool!

Hot Article
Hot Tools

SublimeText3 Mac version
God-level code editing software (SublimeText3)

Dreamweaver CS6
Visual web development tools

WebStorm Mac version
Useful JavaScript development tools

PhpStorm Mac version
The latest (2018.2.1) professional PHP integrated development tool

mPDF
mPDF is a PHP library that can generate PDF files from UTF-8 encoded HTML. The original author, Ian Back, wrote mPDF to output PDF files "on the fly" from his website and handle different languages. It is slower than original scripts like HTML2FPDF and produces larger files when using Unicode fonts, but supports CSS styles etc. and has a lot of enhancements. Supports almost all languages, including RTL (Arabic and Hebrew) and CJK (Chinese, Japanese and Korean). Supports nested block-level elements (such as P, DIV),

