Profiling PHP Code
Question:
How can I measure the execution time of individual functions and files in PHP to identify performance bottlenecks?
Answer:
XDebug is a recommended tool for profiling PHP code. Here's how to use it:
- Enable XDebug: Configure XDebug as an extension in your PHP configuration (PHP.INI).
- Profile Specific Requests: Add XDEBUG_PROFILE=1 as a GET or POST variable in the URL to profile a particular request.
For instance: https://example.com/?XDEBUG_PROFILE=1
- Analyze Results: Use a tool like Webgrind to parse and visualize the profile output. Webgrind is a web-based tool that provides a graphical representation of the profiling data.
The above is the detailed content of How Can I Profile PHP Code to Identify Performance Bottlenecks?. For more information, please follow other related articles on the PHP Chinese website!
 Working with Flash Session Data in LaravelMar 12, 2025 pm 05:08 PM
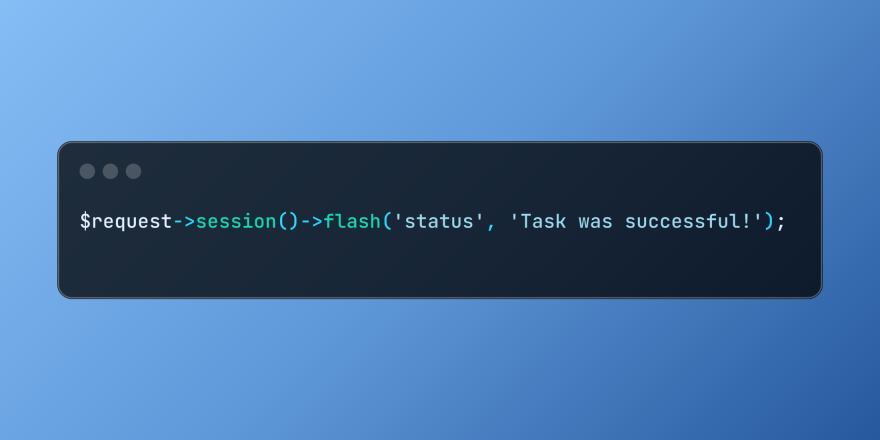
Laravel simplifies handling temporary session data using its intuitive flash methods. This is perfect for displaying brief messages, alerts, or notifications within your application. Data persists only for the subsequent request by default: $request-
 cURL in PHP: How to Use the PHP cURL Extension in REST APIsMar 14, 2025 am 11:42 AM
The PHP Client URL (cURL) extension is a powerful tool for developers, enabling seamless interaction with remote servers and REST APIs. By leveraging libcurl, a well-respected multi-protocol file transfer library, PHP cURL facilitates efficient execution of various network protocols, including HTTP, HTTPS, and FTP. This extension offers granular control over HTTP requests, supports multiple concurrent operations, and provides built-in security features.
 Simplified HTTP Response Mocking in Laravel TestsMar 12, 2025 pm 05:09 PM
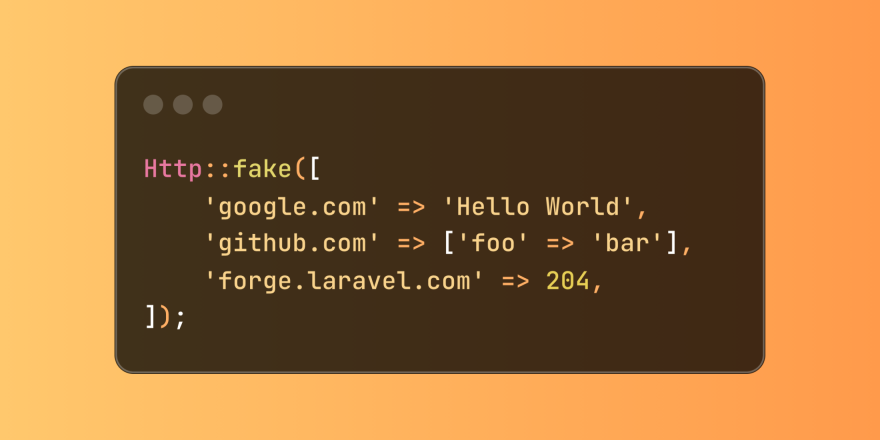
Laravel provides concise HTTP response simulation syntax, simplifying HTTP interaction testing. This approach significantly reduces code redundancy while making your test simulation more intuitive. The basic implementation provides a variety of response type shortcuts: use Illuminate\Support\Facades\Http; Http::fake([ 'google.com' => 'Hello World', 'github.com' => ['foo' => 'bar'], 'forge.laravel.com' =>
 12 Best PHP Chat Scripts on CodeCanyonMar 13, 2025 pm 12:08 PM
Do you want to provide real-time, instant solutions to your customers' most pressing problems? Live chat lets you have real-time conversations with customers and resolve their problems instantly. It allows you to provide faster service to your custom
 Explain the concept of late static binding in PHP.Mar 21, 2025 pm 01:33 PM
Article discusses late static binding (LSB) in PHP, introduced in PHP 5.3, allowing runtime resolution of static method calls for more flexible inheritance.Main issue: LSB vs. traditional polymorphism; LSB's practical applications and potential perfo
 PHP Logging: Best Practices for PHP Log AnalysisMar 10, 2025 pm 02:32 PM
PHP logging is essential for monitoring and debugging web applications, as well as capturing critical events, errors, and runtime behavior. It provides valuable insights into system performance, helps identify issues, and supports faster troubleshoot
 How to Register and Use Laravel Service ProvidersMar 07, 2025 am 01:18 AM
Laravel's service container and service providers are fundamental to its architecture. This article explores service containers, details service provider creation, registration, and demonstrates practical usage with examples. We'll begin with an ove
 Customizing/Extending Frameworks: How to add custom functionality.Mar 28, 2025 pm 05:12 PM
The article discusses adding custom functionality to frameworks, focusing on understanding architecture, identifying extension points, and best practices for integration and debugging.


Hot AI Tools

Undresser.AI Undress
AI-powered app for creating realistic nude photos

AI Clothes Remover
Online AI tool for removing clothes from photos.

Undress AI Tool
Undress images for free

Clothoff.io
AI clothes remover

AI Hentai Generator
Generate AI Hentai for free.

Hot Article

Hot Tools

Safe Exam Browser
Safe Exam Browser is a secure browser environment for taking online exams securely. This software turns any computer into a secure workstation. It controls access to any utility and prevents students from using unauthorized resources.

SecLists
SecLists is the ultimate security tester's companion. It is a collection of various types of lists that are frequently used during security assessments, all in one place. SecLists helps make security testing more efficient and productive by conveniently providing all the lists a security tester might need. List types include usernames, passwords, URLs, fuzzing payloads, sensitive data patterns, web shells, and more. The tester can simply pull this repository onto a new test machine and he will have access to every type of list he needs.

SublimeText3 Mac version
God-level code editing software (SublimeText3)

ZendStudio 13.5.1 Mac
Powerful PHP integrated development environment

SublimeText3 English version
Recommended: Win version, supports code prompts!


