

PEPE Coin: Technical Breakdown and Trading Recommendations

Pepe Coin has been making waves in the crypto market, capturing attention with its meme origins and massive community support. But beyond the memes and internet hype, how is PEPE performing technically, and what should traders and investors expect?

Technical Analysis Summary
At the time of writing, PEPE is trading at 0.000001046, down -0.38% in the last 24 hours. The meme coin has experienced a slight downturn after a period of relative stability. However, technical indicators suggest that the coin could be gearing up for another move, either way.
The 7-period simple moving average (SMA) is currently at 0.000001042, which is very close to the current price. This indicates that the coin is hovering around a short-term decision point. If the price can break decisively above this level, it could signal the beginning of a bullish move.
On a slightly longer time frame, the 25-period SMA sits at 0.000001033, which can be considered a near-term support level. Should the price drop below this, the next crucial support would be the 99-period SMA at 0.000000979. This long-term moving average has provided strong support in the past and could serve as a critical level to watch.
Moving on to the MACD (Moving Average Convergence Divergence) indicator, we can observe that it is currently printing neutral signals. The MACD line is almost parallel to the signal line, indicating that momentum is relatively balanced. However, this calm could precede a storm. If the MACD line crosses above the signal line, it would serve as a bullish signal, potentially sparking a new rally. Conversely, if the MACD line falls below, it could indicate a trend reversal and a potential pullback.
Finally, let's take a glance at the volume, which is an essential factor in determining the strength of a price move. The volume simple moving average (SMA) currently sits at 1.002T, indicating strong but steady trading activity. A sudden spike in volume could catalyze significant price movement, so traders should be ready to act if we see an increase in volume.
Overall, technical indicators are suggesting that PEPE could be preparing for another move, either up or down. Resistance lies at 0.000001100, while support is around 0.000000979. A breakout or breakdown from these levels could dictate the next short-term price direction for PEPE.
The above is the detailed content of PEPE Coin: Technical Breakdown and Trading Recommendations. For more information, please follow other related articles on the PHP Chinese website!

 Tokenized Treasuries Near $6B Milestone, Led by BlackRockApr 19, 2025 am 11:44 AM
The value of blockchain-based U.S. Treasuries is closing in on a new milestone, with total holdings approaching $6 billion.
 title: Canary Capital Is Launching a TRX-Tracking ETFApr 19, 2025 am 11:42 AM
Canary Capital is looking to launch an exchange-traded fund (ETF) tracking the price of Tron's native token, TRX, according to a filing.
 Solana Stablecoin Market Cap Hits Record $12.73 Billion as Sui Supply Reaches $800M with $60M InflowsApr 19, 2025 am 11:40 AM
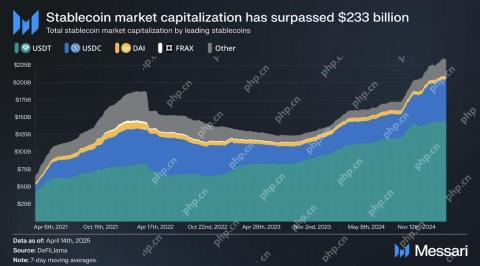
The stablecoin market has surpassed a total capitalization of $233 billion. Within this sector, Solana's stablecoins have reached a new all-time high market capitalization of $12.73 billion
 Canary Capital Files for Staking TRX ETF, Targeting Launch Before Spot Bitcoin ETFsApr 19, 2025 am 11:38 AM
Canary Capital is looking to get the U.S. Securities and Exchange Commission's sign-off for an exchange-traded fund that would track the Tron token TRX and has a staking component.
 MoonPay CEO Ivan Soto-Wright calls on US lawmakers to leave a path open to state-level regulators when passing legislation on stablecoinsApr 19, 2025 am 11:36 AM
In an April 18 X post, Soto-Wright said he wanted Congress to “keep state-regulated issuers in the game” when it comes to stablecoin regulation, referencing efforts in the House of Representatives and Senate to create a federal regulatory framework.
 Michael Saylor Dissects the Philosophy and Technological Potential of Bitcoin in '21 Truths of Bitcoin'Apr 19, 2025 am 11:34 AM
Saylor's ideas centre on the fixed 21 million coin supply of Bitcoin. He presents this shortage as a revolutionary economic idea rather than only a technical one.
 Official Trump (TRUMP) memecoin unlocked 40 million tokens, worth around $300 millionApr 19, 2025 am 11:32 AM
The TRUMP memecoin has gained significant popularity on the Solana network primarily due to its direct affiliation with the U.S. President Donald Trump.
 TRUMP (TRUMP) memecoin unlocks 40 million tokens, worth around $300 millionApr 19, 2025 am 11:30 AM
The TRUMP memecoin has gained significant popularity on the Solana network primarily due to its direct affiliation with the U.S. President Donald Trump.

Hot AI Tools

Undresser.AI Undress
AI-powered app for creating realistic nude photos

AI Clothes Remover
Online AI tool for removing clothes from photos.

Undress AI Tool
Undress images for free

Clothoff.io
AI clothes remover

Video Face Swap
Swap faces in any video effortlessly with our completely free AI face swap tool!

Hot Article
Hot Tools

Atom editor mac version download
The most popular open source editor

SublimeText3 Linux new version
SublimeText3 Linux latest version

SublimeText3 Mac version
God-level code editing software (SublimeText3)

SublimeText3 English version
Recommended: Win version, supports code prompts!

SAP NetWeaver Server Adapter for Eclipse
Integrate Eclipse with SAP NetWeaver application server.

