
 Backend DevelopmentPython TutorialTry natural language data analysis with Streamlit in Snowflake (SiS)
Introduction
Snowflake has released an LLM assistant feature called Snowflake Copilot as a preview feature. With Snowflake Copilot, you can analyze table data using natural language.
On the other hand, Streamlit in Snowflake (SiS) allows you to easily incorporate generative AI and securely access table data. This made me think: could we create a more proactive natural language data analysis tool? So, I developed an app that can analyze and visualize data using natural language.
Note: This post represents my personal views and not those of Snowflake.
Feature Overview
Goals
- Usable by business users unfamiliar with SQL
- Ability to select DB / schema / table via mouse operations for analysis
- Capable of analyzing with very ambiguous natural language queries
Actual Screenshots (Excerpts)
The following are excerpts from analysis results using Cortex LLM (snowflake-arctic).
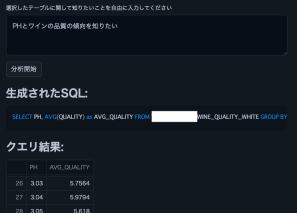

Note: We used this wine quality dataset.
Feature List
- Select Cortex LLM for analysis
- Choose DB / schema / table for analysis
- Display column information and sample data of the selected table
- Analysis using natural language input from users
- Automatic SQL generation for analysis
- Automatic execution of generated SQL
- Display of SQL query execution results
- Data insights provided by Cortex LLM
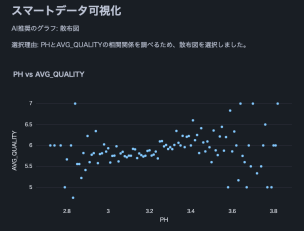
- Data visualization
- Appropriate graph selection and display by Cortex LLM
- Final data interpretation by Cortex LLM
Operating Conditions
- Snowflake account with access to Cortex LLM
- snowflake-ml-python 1.1.2 or later
Precautions
- Be cautious when using large datasets as no data limit is set
- Large result sets from generated SQL queries may take time to process
- Large result sets may cause LLM token limit errors
Source Code
from snowflake.snowpark.context import get_active_session
import streamlit as st
from snowflake.cortex import Complete as CompleteText
import snowflake.snowpark.functions as F
import pandas as pd
import numpy as np
import json
import plotly.express as px

# Get current session
session = get_active_session()

# Application title
st.title("Natural Language Data Analysis App")

# Cortex LLM settings
st.sidebar.title("Cortex LLM Settings")
lang_model = st.sidebar.radio("Select the language model you want to use",
                              ("snowflake-arctic", "reka-flash", "reka-core",
                               "mistral-large2", "mistral-large", "mixtral-8x7b", "mistral-7b",
                               "llama3.1-405b", "llama3.1-70b", "llama3.1-8b",
                               "llama3-70b", "llama3-8b", "llama2-70b-chat",
                               "jamba-instruct", "gemma-7b")
)

# Function to escape column names
def escape_column_name(name):
    return f'"{name}"'

# Function to get table information
def get_table_info(database, schema, table):
    # Get column information
    columns = session.sql(f"DESCRIBE TABLE {database}.{schema}.{table}").collect()

    # Create DataFrame
    column_df = pd.DataFrame(columns)

    # Get row count
    row_count = session.sql(f"SELECT COUNT(*) as count FROM {database}.{schema}.{table}").collect()[0]['COUNT']

    # Get sample data
    sample_data = session.sql(f"SELECT * FROM {database}.{schema}.{table} LIMIT 5").collect()
    sample_df = pd.DataFrame(sample_data)

    return column_df, row_count, sample_df

# Data analysis function
def analyze(df, query):
    st.subheader("Result Analysis")

    # Display basic statistical information
    st.subheader("Basic Statistics")
    st.write(df.describe())

    # Use AI for data analysis
    analysis_prompt = f"""
    Based on the following dataframe and original question, please perform data analysis.
    Concisely explain in English the insights, trends, and anomalies derived from the data.
    If possible, please also mention the following points:
    1. Data distribution and characteristics
    2. Presence of abnormal values or outliers
    3. Correlations between columns (if there are multiple numeric columns)
    4. Time-series trends (if there is date or time data)
    5. Category-specific features (if data can be divided by categories)

    Dataframe:
    {df.to_string()}

    Original question:
    {query}
    """

    analysis = CompleteText(lang_model, analysis_prompt)
    st.write(analysis)

# Data visualization function
def smart_data_visualization(df):
    st.subheader("Smart Data Visualization")

    if df.empty:
        st.warning("The dataframe is empty. There is no data to visualize.")
        return

    # Request AI for graph suggestion
    columns_info = "\n".join([f"{col} - type: {df[col].dtype}" for col in df.columns])
    sample_data = df.head().to_string()

    visualization_prompt = f"""
    Analyze the information of the following dataframe and suggest the most appropriate graph type and the columns to use for its x-axis and y-axis.
    Consider the characteristics of the data to ensure a meaningful visualization.

    Column information:
    {columns_info}

    Sample data:
    {sample_data}

    Please provide only the following JSON data format as your response:
    {{
        "graph_type": "One of: scatter plot, bar chart, line chart, histogram, box plot",
        "x_axis": "Column name to use for x-axis",
        "y_axis": "Column name to use for y-axis (if applicable)",
        "explanation": "Brief explanation of the selection reason"
    }}
    """

    ai_suggestion = CompleteText(lang_model, visualization_prompt)

    try:
        suggestion = json.loads(ai_suggestion)
        graph_type = suggestion['graph_type']
        x_axis = suggestion['x_axis']
        y_axis = suggestion.get('y_axis')  # y-axis might not be needed in some cases
        explanation = suggestion['explanation']

        st.write(f"AI recommended graph: {graph_type}")
        st.write(f"Selection reason: {explanation}")

        if graph_type == "scatter plot":
            fig = px.scatter(df, x=x_axis, y=y_axis, title=f"{x_axis} vs {y_axis}")
        elif graph_type == "bar chart":
            fig = px.bar(df, x=x_axis, y=y_axis, title=f"{y_axis} by {x_axis}")
        elif graph_type == "line chart":
            fig = px.line(df, x=x_axis, y=y_axis, title=f"{y_axis} over {x_axis}")
        elif graph_type == "histogram":
            fig = px.histogram(df, x=x_axis, title=f"Distribution of {x_axis}")
        elif graph_type == "box plot":
            fig = px.box(df, x=x_axis, y=y_axis, title=f"Distribution of {y_axis} by {x_axis}")
        else:
            st.warning(f"Unsupported graph type: {graph_type}")
            return

        st.plotly_chart(fig)

    except json.JSONDecodeError:
        st.error("Failed to parse AI suggestion. Please try again.")
    except KeyError as e:
        st.error(f"AI suggestion is missing necessary information: {str(e)}")
    except Exception as e:
        st.error(f"An error occurred while creating the graph: {str(e)}")

    # AI interpretation of visualization
    visualization_interpretation_prompt = f"""
    Based on the following dataset and created graph, please provide a detailed interpretation of the data trends and characteristics in English.
    Point out possible insights, patterns, anomalies, or areas that require additional analysis.

    Dataset information:
    Columns: {', '.join(df.columns)}
    Number of rows: {len(df)}

    Created graph:
    Type: {graph_type}
    X-axis: {x_axis}
    Y-axis: {y_axis if y_axis else 'None'}
    """

    ai_interpretation = CompleteText(lang_model, visualization_interpretation_prompt)
    st.subheader("AI Interpretation of the Graph")
    st.write(ai_interpretation)

# Function to handle cases where AI response is not just SQL query
def clean_sql_query(query):
    # Remove leading and trailing whitespace
    query = query.strip()
    # If not starting with SQL keywords, remove everything up to the first SELECT
    if not query.upper().startswith(('SELECT')):
        keywords = ['SELECT']
        for keyword in keywords:
            if keyword in query.upper():
                query = query[query.upper().index(keyword):]
                break
    return query

# Function for natural language querying of DB
def data_analysis_and_natural_language_query():
    # Database selection
    databases = session.sql("SHOW DATABASES").collect()
    database_names = [row['name'] for row in databases]
    selected_database = st.selectbox("Select a database", database_names)

    if selected_database:
        # Schema selection
        schemas = session.sql(f"SHOW SCHEMAS IN DATABASE {selected_database}").collect()
        schema_names = [row['name'] for row in schemas]
        selected_schema = st.selectbox("Select a schema", schema_names)

        if selected_schema:
            # Table selection
            tables = session.sql(f"SHOW TABLES IN {selected_database}.{selected_schema}").collect()
            table_names = [row['name'] for row in tables]
            selected_table = st.selectbox("Select a table", table_names)

            if selected_table:
                # Get table information
                column_df, row_count, sample_df = get_table_info(selected_database, selected_schema, selected_table)

                st.subheader("Table Information")
                st.write(f"Table name: `{selected_database}.{selected_schema}.{selected_table}`")
                st.write(f"Total rows: **{row_count:,}**")

                st.subheader("Column Information")
                st.dataframe(column_df)

                st.subheader("Sample Data (showing only 5 rows)")
                st.dataframe(sample_df)

                # Stringify table information (for AI)
                table_info = f"""
                Table name: {selected_database}.{selected_schema}.{selected_table}
                Total rows: {row_count}

                Column information:
                {column_df.to_string(index=False)}
                Sample data:
                {sample_df.to_string(index=False)}
                """

                # Natural language input from user
                user_query = st.text_area("Enter what you want to know about the selected table")

                if st.button("Start Analysis"):
                    if user_query:
                        # Use AI to generate SQL
                        prompt = f"""
                        Based on the following table information and question, please generate an appropriate SQL query.
                        Return only the generated SQL query without any additional response.

                        Table information:
                        {table_info}

                        Question: {user_query}

                        Notes:
                        - Follow Snowflake SQL syntax.
                        - Use aggregate functions to keep the query result size manageable.
                        - Use {selected_database}.{selected_schema}.{selected_table} as the table name.
                        """

                        generated_sql = CompleteText(lang_model, prompt)
                        generated_sql = clean_sql_query(generated_sql)
                        st.subheader("Generated SQL:")
                        st.code(generated_sql, language='sql')

                        try:
                            # Execute the generated SQL
                            result = session.sql(generated_sql).collect()
                            df = pd.DataFrame(result)

                            st.subheader("Query Result:")
                            st.dataframe(df)

                            # Analyze results
                            analyze(df, user_query)

                            # Smart data visualization
                            smart_data_visualization(df)

                        except Exception as e:
                            st.error(f"An error occurred while executing the query: {str(e)}")
                    else:
                        st.warning("Please enter a question.")

# Execution part
data_analysis_and_natural_language_query()
Conclusion
The ability to easily analyze table data using natural language without SQL or Python knowledge could significantly broaden the scope of data utilization in enterprises for business users. By adding features like joining multiple tables or increasing the variety of visualization graphs, even more complex analyses can be performed. I encourage everyone to try implementing data analysis democratization using Streamlit in Snowflake.
Announcements
Snowflake What's New Updates on X
I'm sharing Snowflake's What's New updates on X. Please feel free to follow if you're interested!
English Version
Snowflake What's New Bot (English Version)
https://x.com/snow_new_en
Japanese Version
Snowflake What's New Bot (Japanese Version)
https://x.com/snow_new_jp
Change History
(20240914) Initial post
Original Japanese Article
https://zenn.dev/tsubasa_tech/articles/2608c820294860
The above is the detailed content of Try natural language data analysis with Streamlit in Snowflake (SiS). For more information, please follow other related articles on the PHP Chinese website!

 Python's Execution Model: Compiled, Interpreted, or Both?May 10, 2025 am 12:04 AM
Pythonisbothcompiledandinterpreted.WhenyourunaPythonscript,itisfirstcompiledintobytecode,whichisthenexecutedbythePythonVirtualMachine(PVM).Thishybridapproachallowsforplatform-independentcodebutcanbeslowerthannativemachinecodeexecution.
 Is Python executed line by line?May 10, 2025 am 12:03 AM
Python is not strictly line-by-line execution, but is optimized and conditional execution based on the interpreter mechanism. The interpreter converts the code to bytecode, executed by the PVM, and may precompile constant expressions or optimize loops. Understanding these mechanisms helps optimize code and improve efficiency.
 What are the alternatives to concatenate two lists in Python?May 09, 2025 am 12:16 AM
There are many methods to connect two lists in Python: 1. Use operators, which are simple but inefficient in large lists; 2. Use extend method, which is efficient but will modify the original list; 3. Use the = operator, which is both efficient and readable; 4. Use itertools.chain function, which is memory efficient but requires additional import; 5. Use list parsing, which is elegant but may be too complex. The selection method should be based on the code context and requirements.
 Python: Efficient Ways to Merge Two ListsMay 09, 2025 am 12:15 AM
There are many ways to merge Python lists: 1. Use operators, which are simple but not memory efficient for large lists; 2. Use extend method, which is efficient but will modify the original list; 3. Use itertools.chain, which is suitable for large data sets; 4. Use * operator, merge small to medium-sized lists in one line of code; 5. Use numpy.concatenate, which is suitable for large data sets and scenarios with high performance requirements; 6. Use append method, which is suitable for small lists but is inefficient. When selecting a method, you need to consider the list size and application scenarios.
 Compiled vs Interpreted Languages: pros and consMay 09, 2025 am 12:06 AM
Compiledlanguagesofferspeedandsecurity,whileinterpretedlanguagesprovideeaseofuseandportability.1)CompiledlanguageslikeC arefasterandsecurebuthavelongerdevelopmentcyclesandplatformdependency.2)InterpretedlanguageslikePythonareeasiertouseandmoreportab
 Python: For and While Loops, the most complete guideMay 09, 2025 am 12:05 AM
In Python, a for loop is used to traverse iterable objects, and a while loop is used to perform operations repeatedly when the condition is satisfied. 1) For loop example: traverse the list and print the elements. 2) While loop example: guess the number game until you guess it right. Mastering cycle principles and optimization techniques can improve code efficiency and reliability.
 Python concatenate lists into a stringMay 09, 2025 am 12:02 AM
To concatenate a list into a string, using the join() method in Python is the best choice. 1) Use the join() method to concatenate the list elements into a string, such as ''.join(my_list). 2) For a list containing numbers, convert map(str, numbers) into a string before concatenating. 3) You can use generator expressions for complex formatting, such as ','.join(f'({fruit})'forfruitinfruits). 4) When processing mixed data types, use map(str, mixed_list) to ensure that all elements can be converted into strings. 5) For large lists, use ''.join(large_li
 Python's Hybrid Approach: Compilation and Interpretation CombinedMay 08, 2025 am 12:16 AM
Pythonusesahybridapproach,combiningcompilationtobytecodeandinterpretation.1)Codeiscompiledtoplatform-independentbytecode.2)BytecodeisinterpretedbythePythonVirtualMachine,enhancingefficiencyandportability.


Hot AI Tools

Undresser.AI Undress
AI-powered app for creating realistic nude photos

AI Clothes Remover
Online AI tool for removing clothes from photos.

Undress AI Tool
Undress images for free

Clothoff.io
AI clothes remover

Video Face Swap
Swap faces in any video effortlessly with our completely free AI face swap tool!

Hot Article
Hot Tools

WebStorm Mac version
Useful JavaScript development tools

SublimeText3 English version
Recommended: Win version, supports code prompts!

Dreamweaver CS6
Visual web development tools

DVWA
Damn Vulnerable Web App (DVWA) is a PHP/MySQL web application that is very vulnerable. Its main goals are to be an aid for security professionals to test their skills and tools in a legal environment, to help web developers better understand the process of securing web applications, and to help teachers/students teach/learn in a classroom environment Web application security. The goal of DVWA is to practice some of the most common web vulnerabilities through a simple and straightforward interface, with varying degrees of difficulty. Please note that this software

SublimeText3 Chinese version
Chinese version, very easy to use

