


Note: In this post, we will only be working with Grey-Scale images to make it easy to follow.
What is an Image?
An image can be thought of as a matrix of values, where each value represents the intensity of a pixel. There are three main types of image formats:
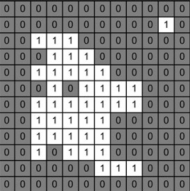
- Binary: An image in this format is represented by a single 2-D matrix with values of 0 (black) and 1 (white). It's the simplest form of image representation.
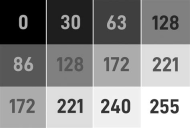
- Grey-Scale: In this format, an image is represented by a single 2-D matrix with values ranging from 0 to 255; where 0 represents black and 255 represents white. The intermediate values represent varying shades of grey.
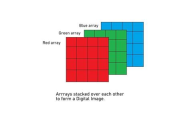
- RGB Scale: Here, an image is represented by three 2-D matrices (one for each color channel: Red, Green, and Blue), with values ranging from 0 to 255. Each matrix contains pixel values for one color component, and combining these three channels gives us the full color image.
Filters
Filters are tools used to modify images by applying certain operations. A filter is a matrix (also called a kernel) that moves across the image, performing computations on the pixel values within its window. We’ll cover two common types of filters: Mean Filters and Median Filters.
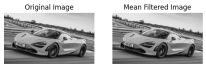
Mean Filters
A Mean Filter is used to reduce noise by averaging the pixel values within a window. It replaces the center pixel in the window with the average of all the pixel values within that window. The cv2.blur() function applies a mean filter with a kernel size of 3x3, which means it considers a 3x3 window of pixels around each pixel to compute the average. This helps in smoothing the image.
import cv2
import matplotlib.pyplot as plt

image = cv2.imread('McLaren-720S-Price-1200x675.jpg', cv2.IMREAD_GRAYSCALE)

# Applies a Mean Filter of size 3 x 3
blurred_image = cv2.blur(image, (3, 3))

plt.subplot(1, 2, 1)
plt.imshow(image, cmap='gray')
plt.title('Original Image')
plt.axis("off")

plt.subplot(1, 2, 2)
plt.imshow(blurred_image, cmap='gray')
plt.title('Mean Filtered Image')
plt.axis("off")
plt.show()

Median Filters
A Median Filter is used to reduce noise by replacing each pixel's value with the median value of all pixels in a window. It’s particularly effective in removing salt-and-pepper noise. The cv2.medianBlur() function applies a median filter with a kernel size of 3. This method replaces each pixel with the median value of the pixel values in its neighborhood, which helps in preserving edges while removing noise. Here the larger the kernel size the more blurred the image gets.
import cv2
import matplotlib.pyplot as plt

image = cv2.imread('McLaren-720S-Price-1200x675.jpg', cv2.IMREAD_GRAYSCALE)

# Applies a Median Filter with a kernel size of 3
blurred_image = cv2.medianBlur(image, 3)

plt.subplot(1, 2, 1)
plt.imshow(image, cmap='gray')
plt.title('Original Image')
plt.axis("off")

plt.subplot(1, 2, 2)
plt.imshow(blurred_image, cmap='gray')
plt.title('Median Filtered Image')
plt.axis("off")
plt.show()
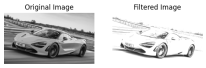
Custom Filters
You can create custom filters to apply specific operations on your images. The cv2.filter2D() function allows you to apply any custom kernel to an image. The cv2.filter2D() function applies a custom kernel (filter) to the image. The kernel is a matrix that defines the operation to be performed on the pixel values. In this example, the kernel enhances certain features of the image based on the specified values.
import cv2
import numpy as np
import matplotlib.pyplot as plt

image = cv2.imread('McLaren-720S-Price-1200x675.jpg', cv2.IMREAD_GRAYSCALE)

# Define a custom filter kernel
kernel = np.array([[2, -1, 5],
                   [-5, 5, -1],
                   [0, -1, 0]])

filtered_image = cv2.filter2D(image, -1, kernel)

plt.subplot(1, 2, 1)
plt.imshow(image, cmap='gray')
plt.title('Original Image')
plt.axis('off')

plt.subplot(1, 2, 2)
plt.imshow(filtered_image, cmap='gray')
plt.title('Filtered Image')
plt.axis('off')

plt.show()
Thresholding
Note: In the code snippets, you will see _ , image when assigning the thresholded image. This is because the cv2.threshold function returns two values: the threshold value used and the thresholded image. Since we only need the thresholded image, we use _ to ignore the threshold value.
Thresholding converts an image into a binary image by setting pixel values based on a condition. There are several types of thresholding techniques:
Global Thresholding
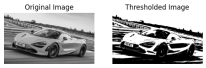
Simple Thresholding
This method sets a fixed threshold value for the entire image. Pixels with values above the threshold are set to the maximum value (255), and those below are set to 0. The cv2.threshold() function is used for simple thresholding. Pixels with intensity greater than 127 are set to white (255), and those with intensity less than or equal to 127 are set to black (0), producing a binary image.
import cv2
import matplotlib.pyplot as plt

image = cv2.imread('McLaren-720S-Price-1200x675.jpg', cv2.IMREAD_GRAYSCALE)

_, thresholded_image = cv2.threshold(image, 127, 255, cv2.THRESH_BINARY)

plt.subplot(1, 2, 1)
plt.imshow(image, cmap='gray')
plt.title('Original Image')
plt.axis("off")

plt.subplot(1, 2, 2)
plt.imshow(thresholded_image, cmap='gray')
plt.title('Thresholded Image')
plt.axis("off")
plt.show()
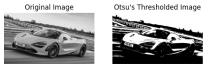
Otsu Thresholding
Otsu's method determines the optimal threshold value automatically based on the histogram of the image. This method minimizes intra-class variance and maximizes inter-class variance. By setting the threshold value to 0 and using cv2.THRESH_OTSU, the function automatically calculates the best threshold value to separate the foreground from the background.
import cv2
import matplotlib.pyplot as plt

image = cv2.imread('McLaren-720S-Price-1200x675.jpg', cv2.IMREAD_GRAYSCALE)

_, otsu_thresholded_image = cv2.threshold(image, 0, 255, cv2.THRESH_BINARY + cv2.THRESH_OTSU)

plt.subplot(1, 2, 1)
plt.imshow(image, cmap='gray')
plt.title('Original Image')
plt.axis("off")

plt.subplot(1, 2, 2)
plt.imshow(otsu_thresholded_image, cmap='gray')
plt.title("Otsu's Thresholded Image")
plt.axis("off")
plt.show()
Adaptive Thresholding
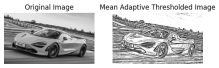
Mean Adaptive Thresholding
In Mean Adaptive Thresholding, the threshold value for each pixel is calculated based on the average of pixel values in a local neighborhood around that pixel. This method adjusts the threshold dynamically across different regions of the image. The cv2.adaptiveThreshold() function calculates the threshold for each pixel based on the mean value of the pixel values in a local 11x11 neighborhood. A constant value of 2 is subtracted from this mean to fine-tune the threshold. This method is effective for images with varying lighting conditions.
import cv2
import matplotlib.pyplot as plt

image = cv2.imread('McLaren-720S-Price-1200x675.jpg', cv2.IMREAD_GRAYSCALE)

mean_adaptive_thresholded_image = cv2.adaptiveThreshold(image, 255, cv2.ADAPTIVE_THRESH_MEAN_C, cv2.THRESH_BINARY, 11, 2)

plt.subplot(1, 2, 1)
plt.imshow(image, cmap='gray')
plt.title('Original Image')
plt.axis("off")

plt.subplot(1, 2, 2)
plt.imshow(mean_adaptive_thresholded_image, cmap='gray')
plt.title('Mean Adaptive Thresholded Image')
plt.axis("off")
plt.show()
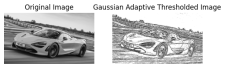
Gaussian Adaptive Thresholding
Gaussian Adaptive Thresholding computes the threshold value for each pixel based on a Gaussian-weighted sum of the pixel values in a local neighborhood. This method often provides better results in cases with non-uniform illumination. In Gaussian Adaptive Thresholding, the threshold is determined by a Gaussian-weighted sum of pixel values in an 11x11 neighborhood. The constant value 2 is subtracted from this weighted mean to adjust the threshold. This method is useful for handling images with varying lighting and shadows.
import cv2
import matplotlib.pyplot as plt

image = cv2.imread('McLaren-720S-Price-1200x675.jpg', cv2.IMREAD_GRAYSCALE)

gaussian_adaptive_thresholded_image = cv2.adaptiveThreshold(image, 255, cv2.ADAPTIVE_THRESH_GAUSSIAN_C, cv2.THRESH_BINARY, 11, 2)

plt.subplot(1, 2, 1)
plt.imshow(image, cmap='gray')
plt.title('Original Image')
plt.axis("off")

plt.subplot(1, 2, 2)
plt.imshow(gaussian_adaptive_thresholded_image, cmap='gray')
plt.title('Gaussian Adaptive Thresholded Image')
plt.axis("off")
plt.show()
References
- Encord.com
- Pyimagesearch.com
- OpenCV Thresholding
- OpenCV Filtering
The above is the detailed content of Introduction To Computer Vision with Python (Part 1). For more information, please follow other related articles on the PHP Chinese website!

 Python's Execution Model: Compiled, Interpreted, or Both?May 10, 2025 am 12:04 AM
Pythonisbothcompiledandinterpreted.WhenyourunaPythonscript,itisfirstcompiledintobytecode,whichisthenexecutedbythePythonVirtualMachine(PVM).Thishybridapproachallowsforplatform-independentcodebutcanbeslowerthannativemachinecodeexecution.
 Is Python executed line by line?May 10, 2025 am 12:03 AM
Python is not strictly line-by-line execution, but is optimized and conditional execution based on the interpreter mechanism. The interpreter converts the code to bytecode, executed by the PVM, and may precompile constant expressions or optimize loops. Understanding these mechanisms helps optimize code and improve efficiency.
 What are the alternatives to concatenate two lists in Python?May 09, 2025 am 12:16 AM
There are many methods to connect two lists in Python: 1. Use operators, which are simple but inefficient in large lists; 2. Use extend method, which is efficient but will modify the original list; 3. Use the = operator, which is both efficient and readable; 4. Use itertools.chain function, which is memory efficient but requires additional import; 5. Use list parsing, which is elegant but may be too complex. The selection method should be based on the code context and requirements.
 Python: Efficient Ways to Merge Two ListsMay 09, 2025 am 12:15 AM
There are many ways to merge Python lists: 1. Use operators, which are simple but not memory efficient for large lists; 2. Use extend method, which is efficient but will modify the original list; 3. Use itertools.chain, which is suitable for large data sets; 4. Use * operator, merge small to medium-sized lists in one line of code; 5. Use numpy.concatenate, which is suitable for large data sets and scenarios with high performance requirements; 6. Use append method, which is suitable for small lists but is inefficient. When selecting a method, you need to consider the list size and application scenarios.
 Compiled vs Interpreted Languages: pros and consMay 09, 2025 am 12:06 AM
Compiledlanguagesofferspeedandsecurity,whileinterpretedlanguagesprovideeaseofuseandportability.1)CompiledlanguageslikeC arefasterandsecurebuthavelongerdevelopmentcyclesandplatformdependency.2)InterpretedlanguageslikePythonareeasiertouseandmoreportab
 Python: For and While Loops, the most complete guideMay 09, 2025 am 12:05 AM
In Python, a for loop is used to traverse iterable objects, and a while loop is used to perform operations repeatedly when the condition is satisfied. 1) For loop example: traverse the list and print the elements. 2) While loop example: guess the number game until you guess it right. Mastering cycle principles and optimization techniques can improve code efficiency and reliability.
 Python concatenate lists into a stringMay 09, 2025 am 12:02 AM
To concatenate a list into a string, using the join() method in Python is the best choice. 1) Use the join() method to concatenate the list elements into a string, such as ''.join(my_list). 2) For a list containing numbers, convert map(str, numbers) into a string before concatenating. 3) You can use generator expressions for complex formatting, such as ','.join(f'({fruit})'forfruitinfruits). 4) When processing mixed data types, use map(str, mixed_list) to ensure that all elements can be converted into strings. 5) For large lists, use ''.join(large_li
 Python's Hybrid Approach: Compilation and Interpretation CombinedMay 08, 2025 am 12:16 AM
Pythonusesahybridapproach,combiningcompilationtobytecodeandinterpretation.1)Codeiscompiledtoplatform-independentbytecode.2)BytecodeisinterpretedbythePythonVirtualMachine,enhancingefficiencyandportability.


Hot AI Tools

Undresser.AI Undress
AI-powered app for creating realistic nude photos

AI Clothes Remover
Online AI tool for removing clothes from photos.

Undress AI Tool
Undress images for free

Clothoff.io
AI clothes remover

Video Face Swap
Swap faces in any video effortlessly with our completely free AI face swap tool!

Hot Article
Hot Tools

mPDF
mPDF is a PHP library that can generate PDF files from UTF-8 encoded HTML. The original author, Ian Back, wrote mPDF to output PDF files "on the fly" from his website and handle different languages. It is slower than original scripts like HTML2FPDF and produces larger files when using Unicode fonts, but supports CSS styles etc. and has a lot of enhancements. Supports almost all languages, including RTL (Arabic and Hebrew) and CJK (Chinese, Japanese and Korean). Supports nested block-level elements (such as P, DIV),

MantisBT
Mantis is an easy-to-deploy web-based defect tracking tool designed to aid in product defect tracking. It requires PHP, MySQL and a web server. Check out our demo and hosting services.

Atom editor mac version download
The most popular open source editor

SublimeText3 Mac version
God-level code editing software (SublimeText3)

SublimeText3 Chinese version
Chinese version, very easy to use

