
 Backend DevelopmentPython Tutorialtimeit.repeat - playing with repetitions to understand patterns
1. The problem
Over your software engineering career, you might encounter a piece of code that performs poorly, taking way longer than acceptable. To make matters worse, the performance is inconsistent and quite variable across multiple executions.
At this point in time, you would have to accept that when it comes to software performance, there is a lot of non-determinism at play. The data can be distributed within a window and sometimes follows a normal distribution. Other times, it can be erratic with no obvious patterns.
2. The approach
This is when benchmarking comes into play. Executing your code five times is good, but at the end of the day, you have just five data points, with too much value placed on each data point. We need to have a much bigger number of repetitions of the same code block to see a pattern.
3. The question
How many data points should one have? Much has been written about it, and one of the papers I covered
Rigorous performance evaluation requires benchmarks to be built,
executed and measured multiple times in order to deal with random
variation in execution times. Researchers should provide measures
of variation when reporting results.
Kalibera, T., & Jones, R. (2013). Rigorous benchmarking in reasonable time. Proceedings of the 2013 International Symposium on Memory Management. https://doi.org/10.1145/2491894.2464160
When measuring performance, we might want to measure CPU, memory, or disk usage to get a broader picture of the performance. It is usually best to start with something simple, like time elapsed, since it is easier to visualize. A 17% CPU usage doesn't tell us much. What should it be? 20% or 5? CPU Usage is not one of the natural ways in which humans perceive performance.
4. The experiment
I am going to use python's timeit.repeat method to repeat a simple code execution block. The code block just multiplies numbers from 1 to 2000.
from functools import reduce
reduce((lambda x, y: x * y), range(1, 2000))
This is the method signature
(function) def repeat(
    stmt: _Stmt = "pass",
    setup: _Stmt = "pass",
    timer: _Timer = ...,
    repeat: int = 5,
    number: int = 1000000,
    globals: dict[str, Any] | None = None
) -> list[float]
What are repeat and number?
Let's start with number. If the code block is too small, it will terminate so quickly that you would not be able to measure anything. This argument mentions the number of times the stmt has to be executed. You can consider this as the new code block. The float returned is for stmt X number execution time.
In our case, we will keep number as 1000 since multiplication up to 2000 is expensive.
Next, move on to repeat. This specifies the number of repetitions or the number of times the above block has to be executed. If repeat is 5, then the list[float] returns 5 elements.
Let's start with creating a simple execution block
def run_experiment(number_of_repeats, number_of_runs=1000):
    execution_time = timeit.repeat(
        "from functools import reduce; reduce((lambda x, y: x * y), range(1, 2000))",
        repeat=number_of_repeats,
        number=number_of_runs
    )
    return execution_time
We want to execute it in different repeat values
repeat_values = [5, 20, 100, 500, 3000, 10000]
The code is pretty simple and straightforward
5. Exploring the Results
Now we reach the most important part of the experiment - which is to interpret data. Please be advised, that different people can interpret it differently and there is no single correct answer.
Your definition of correct answer depends a lot on what you are trying to achieve. Are you concerned with the performance degradation of 95% of your users? Or, are you worried about performance degradation of the tail 5% of your users who are quite vocal?
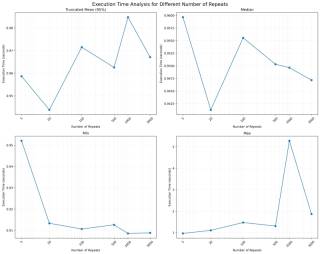
5.1. Execution Time Analysis Statistics for multiple values of repeat
As we can see, the min and max time are whacky. It shows how one datapoint can be enough to change the value of mean. The worst part is that high min and high max are for different value of repeats. There is no correlation and it just showcases the power of outliers.
Next we move to median and notice that as we increase number of repeats, the median goes down, except for 20. What can explain it? It just shows how smaller number of repeats implies that we don't necessarily get the full breath of possible values.
Moving to truncated mean, where the lowest 2.5% and highest 2.5% are trimmed off. This is useful when you don't care about outlier users and want to to focus on the performance of the middle 95% of your users.
Beware, trying to improve the performance of the middle 95% of the users carries the possibility of degrading the performance of the outlier 5% of the users.
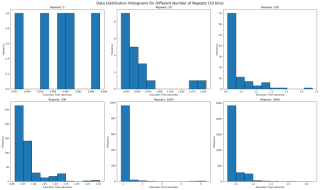
5.2. Execution Time Distribution for multiple values of repeat
Next we want to see where all the data lies. We would use histogram with bin of 10 to see where the data falls. With repetitions of 5 we see that they are mostly equally spaced. This is not one usually expects as sampled data should follow a normal looking distribution.
In our case the value is bounded on the lower side and unbounded on the upper side, since it will take more than 0 seconds to run any code, but there is no upper time limit. This means our distribution should look like a normal distribution with a long right tail.
Going forward with higher values of repeat, we see a tail emerging on the right. I would expect with higher number of repeat, there would be a single histogram bar, which is tall enough that outliers are overshadowed.
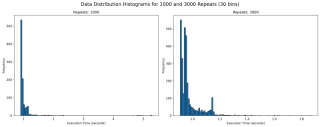
5.3. Execution Time Distribution for values 1000 and 3000
How about we look at larger values of repeat to get a sense? We see something unusual. With 1000 repeats, there are a lot of outliers past 1.8 and it looks a lot more tighter. The one on the right with 3000 repeat only goes upto 1.8 and has most of its data clustered around two peaks.
What can it mean? It can mean a lot of things including the fact that sometimes maybe the data gets cached and at times it does not. It can point to many other side effects of your code, which you might have never thought of. With the kind of distribution of both 1000 and 3000 repeats, I feel the TM95 for 3000 repeat is the most accurate value.
6. Appendix
6.1. Code
import timeit
import matplotlib.pyplot as plt
import json
import os
import statistics
import numpy as np

def run_experiment(number_of_repeats, number_of_runs=1000):
    execution_time = timeit.repeat(
        "from functools import reduce; reduce((lambda x, y: x * y), range(1, 2000))",
        repeat=number_of_repeats,
        number=number_of_runs
    )
    return execution_time

def save_result(result, repeats):
    filename = f'execution_time_results_{repeats}.json'
    with open(filename, 'w') as f:
        json.dump(result, f)

def load_result(repeats):
    filename = f'execution_time_results_{repeats}.json'
    if os.path.exists(filename):
        with open(filename, 'r') as f:
            return json.load(f)
    return None

def truncated_mean(data, percentile=95):
    data = np.array(data)
    lower_bound = np.percentile(data, (100 - percentile) / 2)
    upper_bound = np.percentile(data, 100 - (100 - percentile) / 2)
    return np.mean(data[(data >= lower_bound) & (data
The above is the detailed content of timeit.repeat - playing with repetitions to understand patterns. For more information, please follow other related articles on the PHP Chinese website!

 Python: Exploring Its Primary ApplicationsApr 10, 2025 am 09:41 AM
Python is widely used in the fields of web development, data science, machine learning, automation and scripting. 1) In web development, Django and Flask frameworks simplify the development process. 2) In the fields of data science and machine learning, NumPy, Pandas, Scikit-learn and TensorFlow libraries provide strong support. 3) In terms of automation and scripting, Python is suitable for tasks such as automated testing and system management.
 How Much Python Can You Learn in 2 Hours?Apr 09, 2025 pm 04:33 PM
You can learn the basics of Python within two hours. 1. Learn variables and data types, 2. Master control structures such as if statements and loops, 3. Understand the definition and use of functions. These will help you start writing simple Python programs.
 How to teach computer novice programming basics in project and problem-driven methods within 10 hours?Apr 02, 2025 am 07:18 AM
How to teach computer novice programming basics within 10 hours? If you only have 10 hours to teach computer novice some programming knowledge, what would you choose to teach...
 How to avoid being detected by the browser when using Fiddler Everywhere for man-in-the-middle reading?Apr 02, 2025 am 07:15 AM
How to avoid being detected when using FiddlerEverywhere for man-in-the-middle readings When you use FiddlerEverywhere...
 What should I do if the '__builtin__' module is not found when loading the Pickle file in Python 3.6?Apr 02, 2025 am 07:12 AM
Error loading Pickle file in Python 3.6 environment: ModuleNotFoundError:Nomodulenamed...
 How to improve the accuracy of jieba word segmentation in scenic spot comment analysis?Apr 02, 2025 am 07:09 AM
How to solve the problem of Jieba word segmentation in scenic spot comment analysis? When we are conducting scenic spot comments and analysis, we often use the jieba word segmentation tool to process the text...
 How to use regular expression to match the first closed tag and stop?Apr 02, 2025 am 07:06 AM
How to use regular expression to match the first closed tag and stop? When dealing with HTML or other markup languages, regular expressions are often required to...
 How to get news data bypassing Investing.com's anti-crawler mechanism?Apr 02, 2025 am 07:03 AM
Understanding the anti-crawling strategy of Investing.com Many people often try to crawl news data from Investing.com (https://cn.investing.com/news/latest-news)...


Hot AI Tools

Undresser.AI Undress
AI-powered app for creating realistic nude photos

AI Clothes Remover
Online AI tool for removing clothes from photos.

Undress AI Tool
Undress images for free

Clothoff.io
AI clothes remover

AI Hentai Generator
Generate AI Hentai for free.

Hot Article
Hot Tools

WebStorm Mac version
Useful JavaScript development tools

Zend Studio 13.0.1
Powerful PHP integrated development environment

SublimeText3 English version
Recommended: Win version, supports code prompts!

SublimeText3 Mac version
God-level code editing software (SublimeText3)

DVWA
Damn Vulnerable Web App (DVWA) is a PHP/MySQL web application that is very vulnerable. Its main goals are to be an aid for security professionals to test their skills and tools in a legal environment, to help web developers better understand the process of securing web applications, and to help teachers/students teach/learn in a classroom environment Web application security. The goal of DVWA is to practice some of the most common web vulnerabilities through a simple and straightforward interface, with varying degrees of difficulty. Please note that this software

