
 Technology peripheralsAIFrom bare metal to a large model with 70 billion parameters, here is a tutorial and ready-to-use scripts
From bare metal to a large model with 70 billion parameters, here is a tutorial and ready-to-use scripts

We know that LLM is trained on large-scale computer clusters using massive data. This site has introduced many methods and technologies used to assist and improve the LLM training process. Today, what we want to share is an article that goes deep into the underlying technology and introduces how to turn a bunch of "bare metals" without even an operating system into a computer cluster for training LLM. This article comes from Imbue, an AI startup working to achieve general intelligence by understanding how machines think. Of course, turning a bunch of "bare metal" without an operating system into a computer cluster for training LLM is not an easy process, full of exploration and trial and error, but Imbue finally successfully trained an LLM with 70 billion parameters. And accumulated many useful experiences in the process. This article will provide an in-depth look at the team's process of building their own LLM training infrastructure, and share the many tools and scripts they wrote to facilitate monitoring, inspection, and debugging. If you are interested in building your own LLM training infrastructure or are curious about how LLM is made, then this article is worth reading and collecting. The following is the original article from the Imbue team. Introduction Our small team of researchers and engineers spent several months training a 70 billion parameter model from scratch on our own infrastructure, and the model outperformed zero-sample on inference-related tasks. GPT-4o. Today, we’re sharing the process of setting up the required infrastructure: from putting together the initial cluster and installing the operating system to setting up automatic recovery when errors are encountered during training. We'll detail the challenges encountered and solutions at each step. In addition to these learnings, we will also be releasing many of the scripts we have developed along the way to make it easier for other teams to create stable infrastructure for their own model training. Throughout the process, our team of engineers worked with Voltage Park to prepare computer clusters and build the foundation for production applications. This entire process includes: 1. Configuring each machine 2. Configuring InfiniBand 3. Making sure the machines are fully healthy 4. Diagnosing common training issues 5. Improving infrastructure tools Each step is described in detail below. Background: How it works Our goal in performing computations is to ensure that we can quickly experiment with large language models. To do this, we need a large number of high-speed GPUs that can communicate with each other at high speeds. This article will focus on a cluster with 4088 H100 GPUs spread across 511 machines, or 8 GPUs per machine. The reason there are 511 computers with GPUs is because some connections need to be reserved for the Unified Fabric Manager node, whose role is to manage the InfiniBand network. On the 511 hosts with GPUs, each GPU is directly connected to a ConnectX-7 network card, which can transfer data at 400 Gbps to any GPU on the InfiniBand network. Our InfiniBand network topology is "fully non-blocking," which theoretically allows GPUs to communicate with each other at maximum speed. To do this, we use a three-layer InfiniBand network architecture: three-layer InfiniBand switches. With the right connections, this high level of throughput can be achieved across the entire network. The image below shows an overview of this InfiniBand network:

Please note that communication when training the network occurs over InfiniBand, not Ethernet. Although these machines are also connected to Ethernet, the role of this network is to transport data such as datasets and checkpoints. If you use Ethernet to send data, it will be much slower because the data is transferred from the GPU to the CPU and then out through the Ethernet card at 100 Gbps speeds. While it's possible to train over Ethernet using a technology called RDMA over Converged Ethernet (RoCE), that requires a lot of extra work on both the hardware and software side and is generally less reliable than InfiniBand. Details can be found in this paper: https://arxiv.org/pdf/2402.15627
There is also a secondary Ethernet used only for configuration and management, allowing access to the BIOS (Basic Input Output System), power supply and other low-level machines The control interface of the interface. Without this management network, we would have to manually set up each node via a USB driver, keyboard, and monitor. For situations with hundreds of machines, this is not a sustainable approach.
Achieving high-performance training on this cluster requires every component (InfiniBand, Ethernet, GPU, and the nodes themselves) to work near-perfectly. If any of those 12,000+ connections are a little unstable, it can slow down the overall training run.
The next content of this article is to introduce how to make everything run perfectly and stably.
Procedure: How to turn bare metal into a fully operational cluster
Configuring each machine
After establishing the initial Ethernet connection to the cluster through the management network, access to the baseboard management controller (BMC/baseboard management controller) is obtained certificate. A BMC is a dedicated service processor that remotely monitors host systems and is usually connected to a separate network. It allows us to operate the machine as if we were physically present, and additionally provides APIs for hardware health, BIOS settings, and power management.
After equipping these components, we can roll up our sleeves and start setting up the cluster.
Step 0: Configure a Machine First
We started by installing Ubuntu 22.04 on a server using iDRAC (Dell’s baseboard management controller), and then set up everything else based on this operating system. One of the capabilities of iDRAC is to allow the installation and booting of ISO images from the local computer and provide a virtual console through the browser. Ideally, this is the only manual installation step in the process.
Step 1: Install the operating system on each machine
After configuring the first machine, proceed to install Ubuntu's Metal-as-a-Service (MAAS) software to help configure the remaining servers. Use the Preboot Execution Environment Protocol (PXE) boot and automation iDRAC tool to instruct each machine to boot from the network and configure MAAS to respond to PXE boot requests. When performing an initial network boot, the server obtains an IP and an initial kernel from MAAS via Dynamic IP Allocation Protocol DHCP without having to install anything on the local drive. This is the basic environment for automating repeatable operating system installations. Theoretically, we just have to wait for the first boot and everything will be taken care of. But in practice, MAAS integration with BMC is unreliable, so we use the iDRAC API to collect each machine's MAC address (a unique physical hardware identifier) beforehand.
During this entire training process, MAAS is usually the more reliable component of the vertebral stack. However, we encountered some issues in the beginning that were unique to our setup. For example, when configuring the first few machines, I was unable to install anything via apt due to HTTPS certificate verification issues because the clocks were so far apart. Relatedly, since the MAAS server has to be responsible for a lot of things (DHCP server, DNS server for resolving hostnames to IPs, HTTP proxy between the host and the official Ubuntu package server, NTP server, cloud-init configuration management , a ground truth database used to connect MAC address to IP to hostname to custom metadata), so it is difficult for us to solve these problems from the root cause. Additionally, there is the issue of the learning curve of the MAAS configuration lifecycle, as the design goal is to handle the complexity of managing greenfield deployments and the gradual migration of nodes and various debug/unhealthy intermediate states.
Step 2: Diagnose Broken Machines
We found that about 10% of machines failed to boot, mostly due to physical issues with the server. This is a common scenario for setting up large GPU clusters. Situations we encountered include: missing or incorrect network cables, hardware issues in the iDRAC, damaged power supply units, damaged NVME (non-volatile memory fast) drivers, missing internal wiring, network cards or GPUs not displaying. We automatically checked for these issues, returned some machines to Dell for retesting, and submitted appropriate work orders for data center staff. One advantage of configuring the cluster ourselves is that we can immediately use healthy machines while waiting for maintenance on some machines.
Step 3: Minimum Viable Observable Machine
We proceed with setting up the following on each server:
1.Docker (to make it easier to run services and training jobs)
- Data center GPU driver
3. Prometheus node export tool (used to export stable hardware/operating system indicator data flow)
4. DCGM export tool (used to export additional indicator data from NVIDIA GPU, such as GPU status, clock , utilization) - All non-OS driven RAIDZ ZFS pools, which allow machines to continue working even if a driver fails, while also providing transparent compression for free (especially for plain text data sets and repetitive logs) Useful - using this tool typically increases the usable space by a factor of 10 compared to not using the tool)
We then run basic GPU diagnostics to determine if the GPU is generally functioning - if not, it usually occurs within a few seconds Hardware issues occur within hours.
During this time, we encountered bandwidth bottlenecks when trying to install packages on all 400 nodes simultaneously. This is the first time we have received high temperature overheating alerts on multiple components deployed in our data center. These first batch of heating issues have largely been resolved through firmware updates.
Step 4: Single-node GPU training
The next step is to ensure that each machine can handle real GPU workloads on its own. Many machines are unable to do this. Problems include:
GPU related errors. These problems can basically be solved by reinserting the GPU card into the card slot: slide the 200-pound server out of the rack and remove it. Remove all cables between the case cover and the GPU, then remove the GPU, reinstall the GPU, then reattach the cables and push the server back into the rack.
According to Ubuntu server logs, many cables between the GPU and the PCIe bus or network card issued this error: "limited width: x4 There are also some miscellaneous glitches affecting several hosts. Dell helped us resolve a few issues with a firmware upgrade:
The NVMe drive showed no glitches, but locked up the entire machine when touched.
Hard drives appear in random order under Linux, causing confusion for MAAS and causing the operating system to be installed on the wrong drive.
Wrong temperature reading, which causes the fan to run at full speed all the time. The reason may be a problem with the NVIDIA driver, which is solved by downgrading the driver version.
The CPU's dynamic scaling is out of control, limiting working cores to 2 GHz.
Direct GPU-GPU communication (GDR or GPUDirect RDMA Peer Memory Client) cannot be applied successfully.
Configure InfiniBand
Step 0: Install UFM
One of the advantages of InfiniBand is its centralized design, so that the entire network has one brain. Therefore, we only have to deal with one instance of the 320 network switches in the entire network fabric. Our first task was to figure out which switch connected which machines, then associate that with the wiring diagram and rename them based on the physical location of the switch.
Step 1: Rewiring
Initially, UFM was unable to detect those 320 switches, let alone the hosts that were supposed to be present in the fabric. After consulting with our data center partners, we confirmed that the switches were powered on and wired, but were still unable to detect them. After examining the network cabling list, we noticed that the top-level design of the network structure was incorrect: instead of being unified, the structure was divided into eight disconnected networks with no common routing path. After rewiring, we added a check step to verify that all physical connections are consistent with the new design.
Step 2: Ten thousand temperature alarms (alert)
After solving the physical wiring problem, InfiniBand successfully established connections with all InfiniBand switches in the network structure. However, nearly every switch port started reporting excessive temperatures, sometimes exceeding 70°C, even though they were not transmitting data. We found that the issue stemmed from the open space between switches in the same rack, which caused hot air to flow back to the front. Our data center partner helped us quickly diagnose the issue and develop an appropriate resolution.
Step 3: 1800 Alarms
Many ports also have high error rates, or fluctuate back and forth between normal and damaged states, which is called "flapping." These issues only arise when the ports are actually being used, so they are difficult to detect in advance because our entire fabric consists of 10,000 highly redundant links. Our data center partner helped clean and reinstall the alarm's ports, and we disabled the remaining alarm transceivers while we awaited replacement.
Although InfiniBand is resilient to hardware failures, once around 10% of the fabric starts to fail, features like adaptive routing don't work reliably to account for the occasional lost link.
During this time, we successfully ran multi-node training using 100 to 200 machines. Our process is somewhat improvised: we sometimes spin up a random set of nodes, observe their performance, and then try to keep as many of them running as possible.This method allows us to find a reliable subset of the InfiniBand network structure, but it is very difficult because each time we need to change the set of nodes used for training, and therefore the default InfiniBand links.
Step 4: InfiniBand Burning
To diagnose InfiniBand issues more efficiently, we designed a workload for the entire cluster that pushed as much data as possible through every port in the entire fabric simultaneously. This is different from running a large all-reduce workload across the entire cluster, which requires using NCCL to optimize communication among individual nodes by using NVLink for GPU communication via Server PCIe Module (SXM) slots.
Instead we opted for a brute force approach and succeeded with ease. UFM will start issuing alerts when data transfer volume on most ports exceeds 97% of theoretical capacity, and some switches will temporarily go down. Every port we thought made it to the end of the day was robust enough, and the rest were disabled or removed pending repairs.
Step 5: GPUDirect RDMA
To allow GPU communication without incurring CPU computing overhead, we enable a feature called GPUDirect RDMA, which allows direct communication between InfiniBand network cards. This involves two key steps: - Start an additional core module
- Make sure the PCIe Access Control Service (ACS) is disabled to prevent immediate hangs
Step 6: Amplify the "golden" server
To use When building a GPU cluster with the latest hardware, a rule of thumb is: about 3% of the machines will have problems every week, so be prepared.
However, it needs to be explained: not every machine has a uniform 3% chance of failure, but a small number of untreated machines have various problems repeatedly until they are properly repaired. This highlights the advantages of having a large number of machines in the same network structure. So instead of just finding random machines to run large-scale training on, like whack-a-mole to see what breaks, our approach is to focus on scaling servers that are known to be reliable, the “golden” servers.
Step 7: Maintenance
Maintenance of InfiniBand primarily involves responding to UFM alarms, replacing faulty cables and transceivers, and occasionally diagnosing more difficult errors (such as switch failures). There are usually two factors that lead to large-scale maintenance: - Firmware updates, especially when only half of the cluster has completed the update, this can lead to UFM state corruption and necessitate a UFM restart on all InfiniBand switches.
2. Massive reboot of GPU boxes at the same time, which may flood the UFM state with a large number of updates and also require restarting the UFM service.
Ensuring the Machine is Fully Healthy
During this process, we discovered multiple ways in which individual machines could malfunction or slow down training. Many of these failure modes are not immediately apparent, so we wrote a number of health check scripts to check whether the host was healthy enough. We published the code here: https://github.com/imbue-ai/cluster-health
Please note that many of these health checks are specific to our runtime environment and are not necessarily related to the underlying hardware, Nor is it necessarily easy to fix or automate. This was by design: to achieve the overall goal of getting our machines ready for training, we wanted a single entry point that could answer a straightforward yes or no, and that could summarize any number of fine details.
GPU Health Check
We check that the number of GPUs is correct, that the ECC (Error Correction Code) check is enabled, and that there are no ECC errors. We also checked that the NVLink topology (which connects GPUs to each other) is up and error-free.
Disk Space Health Check
We check whether the host’s disk space utilization exceeds 95%.
Docker Health Check
We checked whether Docker can run the container with the GPU connected (i.e. whether the NVIDIA Container Runtime is working properly), and also checked whether the Docker container related to monitoring/analysis has been activated and obtained the correct host permissions.
Dmesg Health Check
We checked dmesg for hardware Xids or SXid errors (faults caused by NVIDIA GPUs or inter-GPU NVIDIA switches). We also read all dmesg log lines to verify that they can all be classified into the "common/expected log lines" list.
iDRAC Health Check
We checked for iDRAC errors on the machine, which ignored non-fatal error messages. This is a check specific to Dell computers, so it is not included in our open source code.
Disk Health Check
We checked that zpool is installed, that Docker is properly connected to it, and that it can actually reach it without locking up the CPU.
InfiniBand Health Check
We check whether InfiniBand error rates are increasing and/or the driver firmware is out of date.
Nvlink Health Check
We checked for NVLink errors on the machine. In practice, this does not seem to cause training failures, but it may slow down training.
GDR Health Check
We checked whether GDR is enabled on the machine.
VBIOS Health Check
We checked that the VBIOS version of the GPU and the H100 baseboard firmware are up to date.
Flint Health Check
We used flint and hca_self_test to check that the Mellanox OFED driver, network card firmware, and transceiver firmware are the correct versions, and that they are compiled correctly for the NVIDIA driver.
PSB Health Check
We queried the PCIe devices to check that the speed and width of the connection between the GPU, PSB (PCIe Switch Bus), and network card were what we expected. We also checked that the switch firmware is up to date. This script was developed by Dell, not Imbue, so we can't share it at this time.
In addition to these quick health checks, we also perform some more complex health checks, including:
Initializing matrix calculations via PyTorch, and measuring NVLink bandwidth and GPU compute speed and memory. We set the appropriate GDR flags to test InfiniBand and NVLink.
Use ib_write_bw and –use_cuda to send data through the IB card and measure PCIe and InfiniBand card bandwidth. This process lasted for an extended period of time (approximately 15 minutes) to ensure that the fluttering InfiniBand link was identified.
Run a multi-node diagnostic run to check NCCL initialization capabilities and whether it stalls randomly. If there are stalls, our forked NCCL code adds additional logging. This takes 12 to 24 hours to detect a problem, so we typically only run this on new nodes or if we suspect a problem.
Check DCGM export for any GPU clock throttling events (excluding expected gpu_idle and power_cap). To check for these power events, the best way is to run a multi-node training that checks all GPUs, InfiniBand cards, and CPUs and disks simultaneously.
Diagnose common training issues
Once the hardware is working properly, you can start training.
This section will share some specific debugging steps and insights based on our experience running large language model training on our cluster.
Crash on startup
In a way, this is the best bug you can encounter because it's (theoretically) easy to reproduce and iterate on.
We first checked that our code was running on the correct version, configuration and environment variables. Although basic, we found this to be critical: ensuring that the startup training process is reproducible and easy to check. One big reason is that intermediate abstractions like Docker image caching or opaque secret configurations can cause confusion.
Another basic check we perform is to ensure all machines are online and the stack traces or logs emitted can be easily aggregated and inspected. We used Loki, Prometheus, and Grafana software stacks, but any suitable log aggregation or tracking SaaS tool will do. Because these training runs are synchronous and distributed in nature, the first error often leads to a cascade of unrelated errors. Here, health checks can also help detect errors like a corrupted hard drive or a missing or invalid GPU right away.
We built a system that automatically restarts in the event of a failure, which makes log and error aggregation even more important to avoid confusing errors from different restarts. Some common errors we encounter include:
1. "Forward order differs across ranks: rank 0 is all-gathering 43 parameters while rank 1228 is all-gathering 1 parameters". We found this to be a strange feature of PyTorch's Fully Sharded Data Parallel (FSDP) implementation, which was resolved with a restart.
2. GPU Out of Memory (OOM) error, which looks like this: "CUDA out of memory. Tried to allocate..." By checking our configuration and code multiple times and undoing recent code modifications (due to inconsistent PyTorch device specifications during startup Correctly causing excessive usage of GPU #0), we fixed these issues.
3.CPU/RAM Out of Memory (OOM) errors. These errors are not easy to find in error logs and can usually be detected through the dmesg log of the host outside the Docker container. When OOM Killer is called to stop a forked process or network peer, we can see that they mainly manifest as CalledProcessError or ConnectionError. When an OOM Killer call is detected from dmesg, we prefer to simply abandon the health check and reboot the box. We also checked our code paths for adequate manual garbage collection (there's a section below on how to disable this), and also checked for any unexpected attempts to compute or move tensors onto the CPU.
Crash during training
The first task is to enable the system to run automatically, so that it can automatically re-run all health checks, and then restart when no unhealthy hosts are found. We encountered some random hardware errors, including Xid and SXid errors; these could crash the run without emitting a meaningful Python stack trace. Some issues, such as row remapping, can be recovered by rebooting. Others, such as uncorrectable ECC errors, often require hardware maintenance or replacement parts.
Additionally, we observed that malformed training data can also cause crashes. For example, if there is a very large single document in the corpus, it may cause an out-of-memory error on the GPU or CPU.To prevent this problem, we implemented a fully deterministic data loader - making every crash easily reproducible by being tied to an epoch or step number. We've found that disabling data loading or replacing fake data (such as all-zero data) helps confirm whether the root cause of the error is the data.
Finally, it’s also helpful to record network and general node health statistics via metric aggregation methods. Issues such as a brief Ethernet disconnect or low disk space may not appear as useful error messages, but can be easily correlated with collected data.
Hangs without stack traces (and possibly timeouts later)
Debugging these types of errors can be frustrating due to the lack of helpful information and the difficulty of reliably reproducing them.
One of the most memorable error types is accompanied by an error message like this:Watchdog caught collective operation timeout:WorkNCCL (SeqNum=408951, OpType=_ALLGATHER_BASE, … , Timeout (ms)=600000) ran for 600351 milliseconds before timing out
and this error message is issued by all GPU workers in the training run.
This means that one or more hosts failed to complete the NCCL operation or the NCCL and InfiniBand connections crashed, causing all other hosts to be stuck on a tensor operation at the same time until the NCCL_TIMEOUT timeout was reached. Unfortunately, due to the nature of the NCCL software library, it is difficult to find which host is causing the problem.
We have made some modifications to the logging of the NCCL software library, see our forked version: https://github.com/boweiliu/nccl. This may better reveal the messages or operations being performed when a crash occurs, and thus determine which host or GPU may be blocking the execution.
Please note that in order to identify misbehaving hosts we often need to figure out which hosts are not generating certain log messages. The absence of such messages indicates that the worker on this host has fallen behind or crashed.
Other unresponsive situations with no available error messages are usually related to hardware-related issues, such as the previously mentioned Xid/SXid/ECC errors that cause the NVIDIA driver or NVIDIA Docker communication driver to lock up. To distinguish NCCL hangs from driver hangs and race conditions or deadlocks in Python code, we use tools such as Py-Spy and the GNU Project Debugger (GDB) to debug encountered stalled processes in real time. One specific issue was discovered using this approach: due to a configuration error in the Python thread settings, we were unable to correctly launch eight multi-threaded NCCL GPU processes on some hosts, which encountered a race condition in the initialization code stage before PyTorch.
- Training Slowdown (measured by MFU)
The lack of tools makes this type of problem even more frustrating than the previous one. In addition to using Py-Spy, stack trace inspection, and GDB, we also employed NVIDIA Nsight and profiling tools, some of which are difficult to use in highly distributed settings.
Unfortunately, there are many reasons for a general slowdown or slower speed than the model floating point utilization (MFU) demonstrated previously.
First of all, it turns out to be useful to check configuration, code and environment variables multiple times. Errors we have experienced include running the wrong model, wrong batch size, wrong UFM or NCCL settings, CUDA_DEVICE_MAX_CONNECTIONS errors. This will result in sub-optimal performance.
We also find it useful to measure instantaneous (i.e. per-batch) MFU (rather than smoothed or windowed averages), as unsmoothed MFU curves often help diagnose problem classes. Issues that cause training to slow down include:
- Starting training immediately from a very low MFU (less than one-tenth of expected) and staying stable
This is most likely a hardware issue with the InfiniBand network connection, such as the T2 or T3 layer The switch crashes. Hardware issues between the GPU and NIC may also cause this situation, for which dmesg will report an error like this: PCIe x16 lanes limited by…
- Start training immediately from 30% of the expected MFU and remain stable
The reason may be one The host has incorrect GDR settings (NVIDIA peer memory) or incorrect GDR environment variables.
- Start training immediately from about 60-80% of the expected MFU and remain stable
The most common reason is poor InfiniBand link quality or failure, especially a single GPU failure related to the InfiniBand NIC, resulting in NCCL Try routing traffic via local NVLink and using the NIC on another GPU on the same host. CPU throttling can also cause this issue, which requires adjusting BIOS settings on some hosts.
- Sudden huge slowdown (down by 10x) when processing certain batches of data, and this happens quite often
This is basically all about checkpointing or evaluation - this can be determined by checking the number of epochs or steps verify. Annoyingly, if you set up automatic alerts when the MFU is abnormal, there will be many false positives.
- Sudden huge slowdown (down by 10x) while processing certain batches of data
This happens randomly and fairly rarely (probably once every 15 minutes) and is fully restored to good immediately afterwards MFU.
The most common cause seems to be that other CPU-intensive workloads are scheduled to a running host. We found that rather than building profiling tools to identify specific hosts, it was easier to roughly monitor the CPU by PID. The cause may be occasional network connectivity issues, such as data loader bottlenecks. We monitored metrics data for data loads, checkpoints, and any non-NCCL code and added Python code timing logs, which proved to be very reliable.
- MFU gradually slows down while running, but goes back to 100% after every reboot
Theoretically, the cause could be heat buildup on the switch, but we've never seen this happen. However, using Python and NVIDIA profilers we determined that the cause of the performance degradation appears to be automatic garbage collection.

While debugging to resolve these slowdowns, we discovered that throughput was almost bound to drop periodically. As training progresses, this decline will have an increasing impact on distributed computing. This led us to speculate that the cause of the drop might be related to automatic garbage collection - a suspicion we verified through analysis and testing. When we disabled automatic garbage collection and set garbage collection only at specific intervals on all hosts, this throughput "drop" disappeared.
We use FSDP, a synchronous distributed training algorithm based on ZeRO-3. During a blocking operation, a single worker process running garbage collection may slow down all other workers. If you have hundreds of worker processes, this can cause significant slowdowns.
Performance is good at first, then drops suddenly (up to 70% of expected) and continues at high frequency (every 15 seconds)
We observed that this is related to the "clock throttling reason" of NVIDIA GPU, which can be solved by NVIDIA DCGM solves this problem with appropriate settings. Thermal issues (high GPU temperature or failed/reduced effectiveness of the console cooling fan) or power supply failure can cause this issue. Also, when we max out all 8 GPU utilization and 8x NIC InfiniBand utilization along with CPU/RAM/disk, some of our hosts with specific power supply hardware have voltage issues, but only use them all (usually only on This only occurs during the actual training run).
Performance Issue Correlation
- Good performance but more noise than usual (high frequency white noise variance between 90% and 100% of expected MFU)
This is also related to InfiniBand hardware, but usually There is some degree of performance degradation or jitter due to the links at higher layers in the network, rather than the less redundant hosts to the T2 layer.
Unfortunately, many of these issues are difficult to pinpoint to a specific host, and InfiniBand-related issues are particularly difficult to pinpoint due to the topology-aware nature of InfiniBand switch technology. InfiniBand appears to favor adjacent hosts in the InfiniBand fat-tree design, while UFM can route packets at asymmetric link speeds.
Completeness Checklist for Debugging Throughput Issues
The following is a simple summary/flowchart/completeness checklist for debugging throughput issues:
- Has this system been working properly before?
- What changes have you made recently (such as merging code, updating drivers)?
- Is the host you are running healthy? Are all your dependent services running properly, including third-party SaaS, such as Docker Hub, GitHub, etc.?
- Are you sure that the code, environment, configuration, version, host list, ranking order, and random seed running now are exactly the same as last time? (If such a check can be implemented.)
- Can the problem be reproduced? How does
- relate to other things? Other processes? Daily crontab scheduled tasks? Host or DCGM or UFM indicator?
- Does your tool measure these metrics correctly?
- Does the problem still exist when running a reduced version of the code (using smaller model, fake data, no saving or loading checkpoints)?
Improved Infrastructure Tools
After completing the above steps, you will be able to achieve good performance when training your model... at least until something breaks.
This section will introduce some tools and systems for ensuring consistent and stable training, while ideally requiring as little human intervention as possible. Since we are a small team, we do not have enough manpower to perform manual repairs, so we also want to automate this process as much as possible.
Nearly all the problems we encountered during this process can be attributed to machine or network component failure. These types of failures are common in large clusters, so our approach is to automatically disable the failed machine and network components and send a repair request.
Machine failure
We developed a system that automatically restarts from the most recent checkpoint if a run crashes. In this restart process, each available machine is first health checked, and then each machine is classified based on the health check results it passes; then an attempt is made to restart training on the healthiest machine.
Network component failure
All network failures we observed were detectable by UFM and logged to the UFM event log, so the response was simple: parse the UFM log and take appropriate action.
The UFM event system is very complex and contains dozens of event types. In practice, however, we found that only a few events were problematic, mostly related to link failures or high symbol error techniques. After identifying these events, we can write scripts to parse the UFM event logs, disable the links and ports associated with the recent events, request maintenance work orders for these network components, and re-enable these components when maintenance is completed.
Local image file system
For these large-scale distributed training, it has long been discovered that the data exchange speed between the cluster and Ethernet is a major bottleneck. The bandwidth of a shared Ethernet connection is approximately 10Gbit/s; this can quickly saturate if hundreds of workers are simultaneously downloading datasets and model checkpoints.
To this end, we decided to build a local file system inside our cluster as a mirror of cloud storage, which is essentially a cache space that can reduce the amount of files read from S3. To account for cluster churn (i.e., when a machine is disabled or replaced for maintenance reasons), we have three copies of each file and use consistent hashing to evenly distribute the load to maximize performance during cluster churn. Reduce file movement significantly. Since the cluster has limited disk space, we had to develop tools to track the lifecycle of files and purge files that were no longer useful.
Local Distributed Docker Registry
We used Kraken, a great open source software for peer-to-peer transfer of Docker images. We had almost no problems with the software, which was quite surprising to us, considering the complexity of our tasks and implementation. Tool address: https://github.com/uber/kraken
Various performance monitoring tools
We set up the default Torch analyzer and NVIDIA's Nsight Systems. The latter helps us understand the exact time required for forward/reverse passes and NCCL communication, and further helps us determine whether a given model size and number of workers will become a bottleneck. However, Nsight Systems is a bit difficult to use because it requires running Docker in privileged mode, which requires disabling security checks related to performance monitoring events, and saving its configuration often requires stopping the entire training process.
Additionally, we have written tools to detect slow training batches and understand their possible causes. We found this useful. The most useful tool monitors how long each batch takes and discards the worker's stack trace if a batch is too slow - making it easier to find hosts with minor hardware or software issues. .
Divide machines into different groups to locate faulty hosts
In the first few months of using this cluster (when health checks were not as thorough as they are now), we often encountered this situation: in a group A malfunction occurred during training on the machine, but it was not clear which machine had the problem. To find faulty hosts, we developed tools that make it easy to split a set of machines into different groups and run smaller trainings on each group of machines.
For example, if a training run on 48 machines fails, then run a smaller training on 6 groups of 8 machines each, and then run a smaller training on 8 groups of 6 machines each. train. Typically, only one run of the two phases will fail, giving us confidence to conclude that a machine that fails in both phases is faulty.
Reflection and Lessons Learned
In the process of setting up and maintaining our infrastructure, we learned some useful lessons:
- A useful practice is to swap the position of the machine. At runtime, it can be helpful to use 10-20% more machines than required so that training can be easily restarted in the event of a machine failure. Setting up cluster networking so that each machine is tightly connected to every other machine allows us to use any working subset of those machines.
- It pays to write tests and automated solutions for every hardware or software failure you encounter, because every problem encountered in training will reoccur. Similarly, for every ambiguous error message, it's worth writing a tool that better explains the error.
- Reproducibility is the key to excellent scientific research. One of the principles we adopted right away was: "Only change one thing at a time," even in the simplest things.
- Trust, but also verify. Whenever we bring in external tools or bring on new people (whether from inside or outside the company), we double-check what they claim, especially if subsequent steps depend on those claims.
Summary
Training large language models requires complex infrastructure from the beginning. We choose to get deeply involved in the details of setting up our infrastructure because we believe it is important to fully understand the systems we operate, and because we believe it is more efficient.
Now, having been through the process, we're glad we took this approach - having full control over our infrastructure and the ability to easily debug at every level of abstraction has proven to be of critical value . While this process required a lot of supervision and iteration, it allowed us to gain a deep understanding of its underlying workflow, build a set of tools for ensuring host health, learn how to automate the system to ensure continuous smooth training, and ultimately build a Set of infrastructure that allows us to quickly and iteratively train cutting-edge language models.
This infrastructure construction process reflects our basic methodology for researching and building AI agents: exploring the details,
The above is the detailed content of From bare metal to a large model with 70 billion parameters, here is a tutorial and ready-to-use scripts. For more information, please follow other related articles on the PHP Chinese website!

 The AI Skills Gap Is Slowing Down Supply ChainsApr 26, 2025 am 11:13 AM
The term "AI-ready workforce" is frequently used, but what does it truly mean in the supply chain industry? According to Abe Eshkenazi, CEO of the Association for Supply Chain Management (ASCM), it signifies professionals capable of critic
 How One Company Is Quietly Working To Transform AI ForeverApr 26, 2025 am 11:12 AM
The decentralized AI revolution is quietly gaining momentum. This Friday in Austin, Texas, the Bittensor Endgame Summit marks a pivotal moment, transitioning decentralized AI (DeAI) from theory to practical application. Unlike the glitzy commercial
 Nvidia Releases NeMo Microservices To Streamline AI Agent DevelopmentApr 26, 2025 am 11:11 AM
Enterprise AI faces data integration challenges The application of enterprise AI faces a major challenge: building systems that can maintain accuracy and practicality by continuously learning business data. NeMo microservices solve this problem by creating what Nvidia describes as "data flywheel", allowing AI systems to remain relevant through continuous exposure to enterprise information and user interaction. This newly launched toolkit contains five key microservices: NeMo Customizer handles fine-tuning of large language models with higher training throughput. NeMo Evaluator provides simplified evaluation of AI models for custom benchmarks. NeMo Guardrails implements security controls to maintain compliance and appropriateness
 AI Paints A New Picture For The Future Of Art And DesignApr 26, 2025 am 11:10 AM
AI: The Future of Art and Design Artificial intelligence (AI) is changing the field of art and design in unprecedented ways, and its impact is no longer limited to amateurs, but more profoundly affecting professionals. Artwork and design schemes generated by AI are rapidly replacing traditional material images and designers in many transactional design activities such as advertising, social media image generation and web design. However, professional artists and designers also find the practical value of AI. They use AI as an auxiliary tool to explore new aesthetic possibilities, blend different styles, and create novel visual effects. AI helps artists and designers automate repetitive tasks, propose different design elements and provide creative input. AI supports style transfer, which is to apply a style of image
 How Zoom Is Revolutionizing Work With Agentic AI: From Meetings To MilestonesApr 26, 2025 am 11:09 AM
Zoom, initially known for its video conferencing platform, is leading a workplace revolution with its innovative use of agentic AI. A recent conversation with Zoom's CTO, XD Huang, revealed the company's ambitious vision. Defining Agentic AI Huang d
 The Existential Threat To UniversitiesApr 26, 2025 am 11:08 AM
Will AI revolutionize education? This question is prompting serious reflection among educators and stakeholders. The integration of AI into education presents both opportunities and challenges. As Matthew Lynch of The Tech Edvocate notes, universit
 The Prototype: American Scientists Are Looking For Jobs AbroadApr 26, 2025 am 11:07 AM
The development of scientific research and technology in the United States may face challenges, perhaps due to budget cuts. According to Nature, the number of American scientists applying for overseas jobs increased by 32% from January to March 2025 compared with the same period in 2024. A previous poll showed that 75% of the researchers surveyed were considering searching for jobs in Europe and Canada. Hundreds of NIH and NSF grants have been terminated in the past few months, with NIH’s new grants down by about $2.3 billion this year, a drop of nearly one-third. The leaked budget proposal shows that the Trump administration is considering sharply cutting budgets for scientific institutions, with a possible reduction of up to 50%. The turmoil in the field of basic research has also affected one of the major advantages of the United States: attracting overseas talents. 35
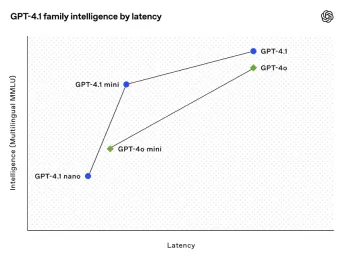 All About Open AI's Latest GPT 4.1 Family - Analytics VidhyaApr 26, 2025 am 10:19 AM
OpenAI unveils the powerful GPT-4.1 series: a family of three advanced language models designed for real-world applications. This significant leap forward offers faster response times, enhanced comprehension, and drastically reduced costs compared t


Hot AI Tools

Undresser.AI Undress
AI-powered app for creating realistic nude photos

AI Clothes Remover
Online AI tool for removing clothes from photos.

Undress AI Tool
Undress images for free

Clothoff.io
AI clothes remover

Video Face Swap
Swap faces in any video effortlessly with our completely free AI face swap tool!

Hot Article
Hot Tools

SublimeText3 Linux new version
SublimeText3 Linux latest version

SAP NetWeaver Server Adapter for Eclipse
Integrate Eclipse with SAP NetWeaver application server.

VSCode Windows 64-bit Download
A free and powerful IDE editor launched by Microsoft

ZendStudio 13.5.1 Mac
Powerful PHP integrated development environment

SublimeText3 Chinese version
Chinese version, very easy to use

