


K-line chart is a charting tool that displays the price changes of a financial asset through candles, including the opening price, closing price, high price and low price. When interpreting candlestick charts, consider candle color (green up, red down), shape, size, and volume. Chart patterns and breakout signals can provide indications of potential trends or reversals. Trading decisions are based on K-line charts, which can identify uptrends (green candles), downtrends (red candles), reversal signals (hammers, dojis, engulfing patterns) and breakout opportunities. However, it should be noted that history does not predict the future. Many factors affect prices, and professionals need to be consulted before trading.

Huobi Futures K-line chart interpretation
What is a K-line chart?
K-line chart is a charting tool used to show the price changes of a financial asset over a specific time period. It consists of a series of vertical bars called candles, each of which represents the open, close, high, and low prices within a specific time period (such as 1 minute, 1 hour, or 1 day).
How to interpret the Huobi futures K-line chart?
The Huobi futures K-line chart consists of the following parts:
Candle body: shows the difference between the opening price and the closing price. A solid candle indicates a closing price that is higher than the opening price (up), while an open candle indicates a closing price below the opening price (down). Upper shadow line: shows the highest price during the time period. Lower shadow: shows the lowest price during the time period. Color: Usually green or red is used to indicate increases or decreases.
Tips for interpreting K-line charts
When interpreting K-line charts, you need to consider the following factors:
Candle color and shape: Solid green candles indicate bullishness, while hollow red candles indicate bearishness. Candle Size: Larger candles indicate large price movements. Shadow length: A longer shadow indicates greater price fluctuations during that time period. Candlestick Patterns: Combinations of specific candlestick arrangements that can indicate a potential trend or reversal signal. For example, hammer, doji and engulfing patterns. Volume: Volume shows the number of trades during a specific time period. Higher volume indicates increased market activity.
How to use K-line charts for trading decisions
K-line charts can help traders identify potential trading opportunities and make informed decisions. For example:
Uptrend: A series of solid green candles indicates an uptrend. Downtrend: A series of hollow red candles indicates a downtrend. Reversal Signals: Patterns such as hammers, dojis, and engulfing patterns can indicate potential reversals. Breakout: A trading signal is usually generated when price breaks through a key resistance or support level.
Notes
The following should be noted when interpreting candlestick charts:
History does not always predict the future: While candlestick charts can provide information about past price action, they do not guarantee future performance. Various factors can affect prices: In addition to technical analysis, there are many other factors that can affect the prices of financial assets, such as news events and economic data. Consult a Professional: Before making any trading decisions, it is always recommended to consult a qualified financial professional.
The above is the detailed content of How to read the K-line of Huobi futures. For more information, please follow other related articles on the PHP Chinese website!

 XRP, HYPE, ONDO Are Showing Fresh Signs of LifeApr 11, 2025 am 11:08 AM
Altcoins are showing fresh signs of life following Trump's 90-day tariff pause, and three names in particular—XRP, HYPE, and ONDO—are catching investor attention.
 Best Crypto Casinos for Instant Withdrawal 2025Apr 11, 2025 am 11:06 AM
What sounds better: winning big and then waiting days for the money to arrive, or playing at crypto casinos with instant withdrawal?
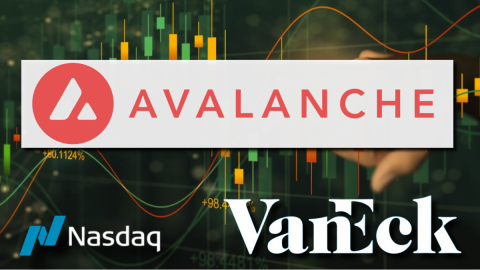 Nasdaq Files to List VanEck Avalanche (AVAX) Trust ETFApr 11, 2025 am 11:04 AM
This new financial instrument would track the token's market price, with a third-party custodian holding the underlying AVAX
 This guide is for informational purposes only. The token(s) discussed as potential rewards may not have launched yet or may never launch.Apr 11, 2025 am 11:02 AM
This guide is for informational purposes only. The token(s) discussed as potential rewards may not have launched yet or may never launch.
 Today, twelve of the world's leading human rights and humanitarian organizations gathered today at London's Frontline Club to announce the formation of the Bitcoin Humanitarian Alliance. The coalitionApr 11, 2025 am 11:00 AM
n Humanitarian Alliance Launches With 12 Founding Members to Harness Bitcoin's Power for Good
 Woman Regains More Than $35000 Lost in a Cryptocurrency ScamApr 11, 2025 am 10:58 AM
CINCINNATI, OH — A 73-year-old Delhi Township woman has regained more than $35,000 lost in a cryptocurrency scam, thanks to the quick action of local police and a specialized unit within the Ohio Bureau of Criminal Investigation (BCI)
 Remittix (RMX) Price Prediction is at a Crossroads TodayApr 11, 2025 am 10:56 AM
Remittix, a new DeFi token, can be one of the best cryptos to put your money in this year, according to most.
 Dogecoin (DOGE) Price Reversal Sets the Stage for a New All-Time HighApr 11, 2025 am 10:54 AM
After a long-running streak of breaking down from support levels, Dogecoin (DOGE) is set to reverse the trend.

Hot AI Tools

Undresser.AI Undress
AI-powered app for creating realistic nude photos

AI Clothes Remover
Online AI tool for removing clothes from photos.

Undress AI Tool
Undress images for free

Clothoff.io
AI clothes remover

AI Hentai Generator
Generate AI Hentai for free.

Hot Article
Hot Tools

Atom editor mac version download
The most popular open source editor

mPDF
mPDF is a PHP library that can generate PDF files from UTF-8 encoded HTML. The original author, Ian Back, wrote mPDF to output PDF files "on the fly" from his website and handle different languages. It is slower than original scripts like HTML2FPDF and produces larger files when using Unicode fonts, but supports CSS styles etc. and has a lot of enhancements. Supports almost all languages, including RTL (Arabic and Hebrew) and CJK (Chinese, Japanese and Korean). Supports nested block-level elements (such as P, DIV),

MantisBT
Mantis is an easy-to-deploy web-based defect tracking tool designed to aid in product defect tracking. It requires PHP, MySQL and a web server. Check out our demo and hosting services.

Dreamweaver Mac version
Visual web development tools

Notepad++7.3.1
Easy-to-use and free code editor

