Weekly overview of the encryption market (6.10-6.16) Casual games are about to explode, and the battle for computing power projects is heating up.
- 王林Original
- 2024-06-18 15:08:50482browse
Written by Mike
A. Market perspective
1. Macro liquidity
Monetary liquidity improves. U.S. CPI fell to a three-year low in May year-on-year, but the Fed's dot plot still shows that it will only cut interest rates once this year, which is slightly hawkish. The market's desire for two interest rate cuts has not been fulfilled. The Fed's approach of trading time for space and preventing the market from prematurely betting on interest rate cuts may be the best choice, leaving room for subsequent policy operations. The S&P Nasdaq Index of the U.S. stock market continued to reach new highs, and the crypto market fluctuated widely.

2. Full market conditions
Top 100 market capitalization gainers list:

This week BTC fluctuated within a wide range, and altcoins generally fell. As BTC continues to attract fiat inflows from ETFs, new funds entering the cryptocurrency market are limited, limiting the market performance of altcoins. In fact, the Altcoin Seasonal Index is back to its first half 2023 lows, with just over 20 of the top 100 altcoins outperforming BTC over the past 90 days. The market hot spots are Base chain Meme, BTC ecosystem and Binance New Coin.
1. IO: It is decentralized AI computing power, which may be pledged in the future. In the same track, RNDR has a market capitalization of US$4.5 billion, and AKT has a market capitalization of US$1 billion. After market rumors that OK was hit, Binance New Coin began to exert force, and the competition was always unpretentious.
2. BRETT: It is the Base chain head Meme, and BRETT is PEPE’s friend. Coinbase’s new wallet directs more traffic to the Base chain.
3. PIZZA: The first BTC five-character inscription, which is the first Meme of Unisat wallet BTC L2. BTC ecological hair is relatively uncurly.
3. BTC market situation
1) On-chain data
BTC inscription transactions declined. Since the April halving, the number of BTC inscriptions has dropped dramatically. Rune trading surged to account for 60% of daily transactions, indicating that speculation has moved away from inscriptions and into the runes market.

#The market value of stablecoins increased by 1%, and the overall trend of capital inflows is improving.

Institutional funds have seen net inflows for five consecutive weeks, and the market expects U.S. monetary policy to cut interest rates.

The long-term trend indicator MVRV-ZScore is based on the total market cost and reflects the overall profitability of the market. When the indicator is greater than 6, it is the top range; when the indicator is less than 2, it is the bottom range. MVRV fell below key levels and holders were generally in the red. The current indicator is 2.4, entering the intermediate stage. The long-term trend indicator MVRV-ZScore is based on the total market cost and reflects the overall profitability of the market. When the indicator is greater than 6, it is the top range; when the indicator is less than 2, it is the bottom range. MVRV fell below the key level of 1, with holders generally in the red. The current indicator is 2.3, entering the intermediate stage.

#2) Futures market
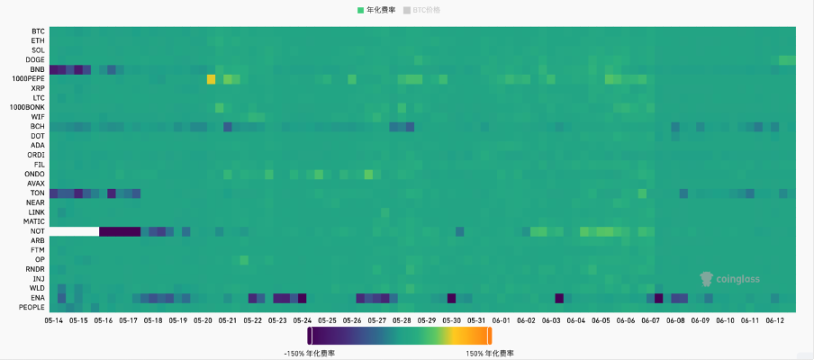
Futures funding rate: The rate dropped slightly this week. The fee rate is 0.05-0.1%, and the long leverage is high, which is the short-term top of the market; the fee rate is -0.1-0%, the short leverage is high, and it is the short-term bottom of the market.


Futures positions: BTC positions fell slightly this week.

#Futures long-short ratio: 1.3, market sentiment is neutral. Retail investor sentiment is mostly a contrarian indicator, with a reading below 0.7 indicating panic and a reading above 2.0 indicating greed. The long-short ratio data fluctuates greatly, and the reference significance is weakened.

3) Spot market
BTC fluctuates widely, and the fluctuation is likely to continue until the end of July. Market liquidity is insufficient, and there are few beta opportunities for sector narratives, mainly alpha opportunities for individual stocks to dominate.


B. Market data
1. Total lock-up volume of the public chain

2. TVL proportion of each public chain

This week’s TVL was 111.6 billion US dollars, an increase of 1.8 billion US dollars, an increase of 1.6%. This week, the mainstream public chains TVL all fell except for the TRON chain. ETH chain, SOLANA chain, and ARB chain all fell by 7%, BSC chain and OP chain fell by 11%, BLAST chain fell by 9%, BASE chain fell by 6%, MERLIN chain fell by 4%, BTC chain and POLYGON chain fell by 5%. It is worth noting that the total TVL of the SOLANA chain is close to 6 billion US dollars. With the recent significant increase in the activity of the SOLANA chain, it seems to be only a matter of time before it surpasses the BSC chain or even the TRON chain in terms of total TVL.
3. Lock-up volume of each chain protocol
1) ETH lock-up volume


2) BSC Lock Amount

#3) Polygon Lock Amount

4)Arbitrum Lock Position volume situation

5) Optimism lock-up volume situation

6) Base lock-up volume situation

7) Solana lock-up volume

4. Changes in NFT market data
1) NFT- 500 Index

2) NFT market situation


The above is the detailed content of Weekly overview of the encryption market (6.10-6.16) Casual games are about to explode, and the battle for computing power projects is heating up.. For more information, please follow other related articles on the PHP Chinese website!

