


1. debugger;
I have said before that you can add a debugger; to the JavaScript code to manually create a breakpoint effect.
Need conditional breakpoints? You just need to surround it with if statements:
debugger;
}
But remember to delete them before publishing the program.
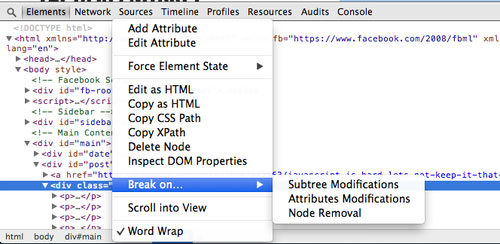
Sometimes you will find that the DOM is not under your control and will undergo some strange changes, making it difficult for you to find the source of the problem.
There is a super useful function in the development tools of Google Chrome, which is specially designed to deal with this situation. It is called “Break on…”. You can see this by right-clicking on the DOM node. menu item.
The triggering condition of the breakpoint can be set when the node is deleted, there is any change in the node's attributes, or there is a change in one of its child nodes.
XHR breakpoints, or Ajax breakpoints, as their name suggests, allow us to set a breakpoint that triggers specific Ajax calls when they occur.
This trick is very effective when you are debugging network transmission of web applications.

There are some very interesting tools in Google Chrome that simulate mobile devices to help us debug the running of programs on mobile devices.
The way to find it is: press F12 to bring up the developer tools, then press the ESC key (the current tab cannot be Console), you will see the second layer of debugging window appear, inside the Emulation tab page A variety of analog devices are available.
Of course, this does not turn into a real iPhone, it just simulates the iPhone's size, touch events and browser User Agent values.

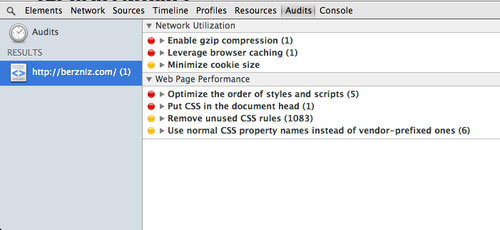
YSlow is a great tool. Google Chrome’s developer tools also have a very similar tool called Audits.
It can quickly audit your website and give you very practical and effective suggestions and methods for optimizing your website.
I don’t know how I would develop without these tools. I’ll be writing more tips on this as well – stay tuned for my latest post once I find out.

 Python vs. JavaScript: A Comparative Analysis for DevelopersMay 09, 2025 am 12:22 AM
The main difference between Python and JavaScript is the type system and application scenarios. 1. Python uses dynamic types, suitable for scientific computing and data analysis. 2. JavaScript adopts weak types and is widely used in front-end and full-stack development. The two have their own advantages in asynchronous programming and performance optimization, and should be decided according to project requirements when choosing.
 Python vs. JavaScript: Choosing the Right Tool for the JobMay 08, 2025 am 12:10 AM
Whether to choose Python or JavaScript depends on the project type: 1) Choose Python for data science and automation tasks; 2) Choose JavaScript for front-end and full-stack development. Python is favored for its powerful library in data processing and automation, while JavaScript is indispensable for its advantages in web interaction and full-stack development.
 Python and JavaScript: Understanding the Strengths of EachMay 06, 2025 am 12:15 AM
Python and JavaScript each have their own advantages, and the choice depends on project needs and personal preferences. 1. Python is easy to learn, with concise syntax, suitable for data science and back-end development, but has a slow execution speed. 2. JavaScript is everywhere in front-end development and has strong asynchronous programming capabilities. Node.js makes it suitable for full-stack development, but the syntax may be complex and error-prone.
 JavaScript's Core: Is It Built on C or C ?May 05, 2025 am 12:07 AM
JavaScriptisnotbuiltonCorC ;it'saninterpretedlanguagethatrunsonenginesoftenwritteninC .1)JavaScriptwasdesignedasalightweight,interpretedlanguageforwebbrowsers.2)EnginesevolvedfromsimpleinterpreterstoJITcompilers,typicallyinC ,improvingperformance.
 JavaScript Applications: From Front-End to Back-EndMay 04, 2025 am 12:12 AM
JavaScript can be used for front-end and back-end development. The front-end enhances the user experience through DOM operations, and the back-end handles server tasks through Node.js. 1. Front-end example: Change the content of the web page text. 2. Backend example: Create a Node.js server.
 Python vs. JavaScript: Which Language Should You Learn?May 03, 2025 am 12:10 AM
Choosing Python or JavaScript should be based on career development, learning curve and ecosystem: 1) Career development: Python is suitable for data science and back-end development, while JavaScript is suitable for front-end and full-stack development. 2) Learning curve: Python syntax is concise and suitable for beginners; JavaScript syntax is flexible. 3) Ecosystem: Python has rich scientific computing libraries, and JavaScript has a powerful front-end framework.
 JavaScript Frameworks: Powering Modern Web DevelopmentMay 02, 2025 am 12:04 AM
The power of the JavaScript framework lies in simplifying development, improving user experience and application performance. When choosing a framework, consider: 1. Project size and complexity, 2. Team experience, 3. Ecosystem and community support.
 The Relationship Between JavaScript, C , and BrowsersMay 01, 2025 am 12:06 AM
Introduction I know you may find it strange, what exactly does JavaScript, C and browser have to do? They seem to be unrelated, but in fact, they play a very important role in modern web development. Today we will discuss the close connection between these three. Through this article, you will learn how JavaScript runs in the browser, the role of C in the browser engine, and how they work together to drive rendering and interaction of web pages. We all know the relationship between JavaScript and browser. JavaScript is the core language of front-end development. It runs directly in the browser, making web pages vivid and interesting. Have you ever wondered why JavaScr


Hot AI Tools

Undresser.AI Undress
AI-powered app for creating realistic nude photos

AI Clothes Remover
Online AI tool for removing clothes from photos.

Undress AI Tool
Undress images for free

Clothoff.io
AI clothes remover

Video Face Swap
Swap faces in any video effortlessly with our completely free AI face swap tool!

Hot Article
Hot Tools

Atom editor mac version download
The most popular open source editor

SAP NetWeaver Server Adapter for Eclipse
Integrate Eclipse with SAP NetWeaver application server.

PhpStorm Mac version
The latest (2018.2.1) professional PHP integrated development tool

SublimeText3 Chinese version
Chinese version, very easy to use

SublimeText3 Linux new version
SublimeText3 Linux latest version

