- Gemeinschaft
- Lernen
- Tools-Bibliothek
- Freizeit
Heim > Fragen und Antworten > Hauptteil
sql3 = 'select sum(comment_num) as  total_col,create_time from article GROUP BY create_time'
df = pd.read_sql(sql3, conn)
print(df)
# 总数
# N = 22
# 宽度
width = 0.45
# ind = np.arange(N)
plt.bar(df['create_time'], df['total_col'], width, color='r', label='total_col')
plt.xlabel(u"发表日期")
plt.ylabel(u"总评论数")
plt.title(u"每日发表文章的总评论数直方分布图")
plt.legend()
plt.show()
df:
   total_col create_time
0         2.0  2017-04-27
1         0.0  2017-05-09
2         3.0  2017-05-10
3         6.0  2017-05-11
4         3.0  2017-05-12
5         2.0  2017-05-13
6         1.0  2017-05-14
7         0.0  2017-05-15
8         5.0  2017-05-16
9         0.0  2017-05-17
10        1.0  2017-05-18
11        0.0  2017-05-19
12        6.0  2017-05-22
13        0.0  2017-05-24
14        1.0  2017-05-25
15        0.0  2017-05-26
16        6.0  2017-05-27
17        4.0  2017-05-29
18       16.0  2017-05-31
19        4.0  2017-06-02
20        2.0  2017-06-04
21        1.0  2017-06-05
Fehler:
Traceback (most recent call last):
  File "D:/PyCharm/py_scrapyjobbole/data_analysis.py", line 46, in <module>
    plt.bar(df['create_time'], df['total_col'], width, color='r', label='total_col')
  File "D:\python-3.5.2\lib\site-packages\matplotlib\pyplot.py", line 2704, in bar
    **kwargs)
  File "D:\python-3.5.2\lib\site-packages\matplotlib\__init__.py", line 1898, in inner
    return func(ax, *args, **kwargs)
  File "D:\python-3.5.2\lib\site-packages\matplotlib\axes\_axes.py", line 2105, in bar
    left = [left[i] - width[i] / 2. for i in xrange(len(left))]
  File "D:\python-3.5.2\lib\site-packages\matplotlib\axes\_axes.py", line 2105, in <listcomp>
    left = [left[i] - width[i] / 2. for i in xrange(len(left))]
TypeError: unsupported operand type(s) for -: 'datetime.date' and 'float'PHP中文网2017-06-12 09:23:54
試試astype()轉換型別,參見stackoverflow
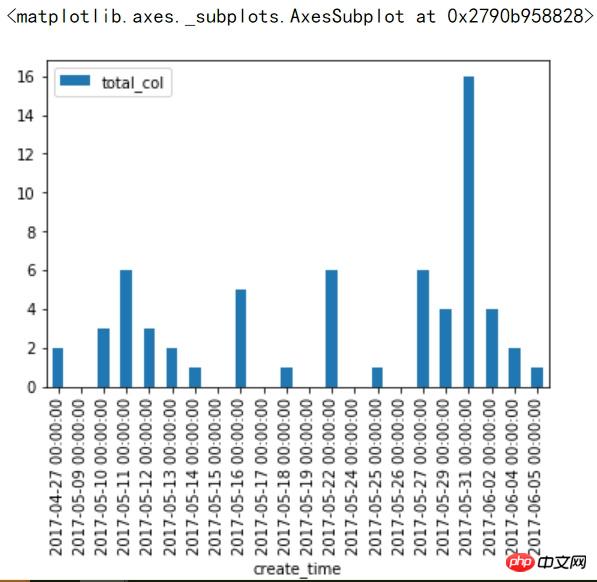
%matplotlib inline
import pandas as pd
df = pd.DataFrame.from_csv('timeseries.tsv', sep="\t")

df['total_col'] = df['total_col'].astype(float)
df['create_time'] = df['create_time'].astype('datetime64[D]')
df.set_index(['create_time']).plot(kind='bar')

世界只因有你2017-06-12 09:23:54
plt.bar(df['create_time'], df['total_col'], width, color='r', label='total_col')
里面的left, height参数应该是数值形的list,你现在df['create_time']传递的是时间类型的列表