Heim >Backend-Entwicklung >Python-Tutorial >Zeichnen Sie Konturdiagramme mit Python Matplotlib
Zeichnen Sie Konturdiagramme mit Python Matplotlib
- WBOYWBOYWBOYWBOYWBOYWBOYWBOYWBOYWBOYWBOYWBOYWBOYWBnach vorne
- 2023-08-30 19:05:011873Durchsuche
Matplotlib ist eine kostenlose Open-Source-Plotbibliothek in Python. Es wird zum Erstellen von 2D-Grafiken und Plots mithilfe von Python-Skripten verwendet. Um die Matplotlib-Funktionalität nutzen zu können, müssen wir zuerst die Bibliothek installieren.
Mit pip installieren
Wir können das neueste stabile Paket von Matplotlib ganz einfach von PyPi installieren, indem wir den folgenden Befehl in der Eingabeaufforderung ausführen.
pip install Matplotlib
Sie können Matplotlib über conda mit dem folgenden Befehl installieren:
conda install -c conda-forge matplotlib
Konturdiagramm wird verwendet, um dreidimensionale Daten in einer zweidimensionalen Oberfläche zu visualisieren, indem konstante Z-Schnitte, sogenannte Konturen, aufgetragen werden.
Die Darstellung erfolgt mithilfe der Konturfunktion (Z), die eine Funktion der beiden Eingaben X und Y (Koordinaten der X- und Y-Achse) ist.
Z = fun(x,y)
Matplotlib bietet zwei Funktionen plt.contour und plt.contourf zum Zeichnen von Konturdiagrammen.
contour()-Methode
matplotlib.pyplot. Die Methode „outline()“ wird zum Zeichnen von Umrisslinien verwendet. Es gibt QuadContourSet zurück. Hier ist die Syntax der Funktion -
contour([X, Y,] Z, [levels], **kwargs)
Parameter
[X,Y]: Optionaler Parameter, der die Koordinate des Z-Medianwerts angibt.
Z: Der Höhenwert des gezeichneten Umrisses.
Ebenen: werden verwendet, um die Anzahl und Position von Konturlinien/-regionen zu bestimmen.
Beispiel
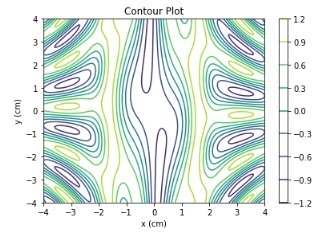
Nehmen wir ein Beispiel für das Zeichnen von Konturlinien mit numpy trigonometrischen Funktionen.
import numpy as np
import matplotlib.pyplot as plt

def f(x, y):
   return np.sin(x) ** 10 + np.cos(10 + y * x) * np.cos(x)

xlist = np.linspace(-4.0, 4.0, 800)
ylist = np.linspace(-4.0, 4.0, 800)

# A mesh is created with the given co-ordinates by this numpy function
X, Y = np.meshgrid(xlist, ylist)
Z = f(X,Y)

fig = plt.figure()
ax = fig.add_axes([0.1, 0.1, 0.8, 0.8])

cp = ax.contour(X, Y, Z)
fig.colorbar(cp) # Add a colorbar to a plot
ax.set_title('Contour Plot')

ax.set_xlabel('x (cm)')
ax.set_ylabel('y (cm)')
plt.show()
Ausgabe

f(x,y) wird mithilfe trigonometrischer Numpy-Funktionen definiert.
Beispiel
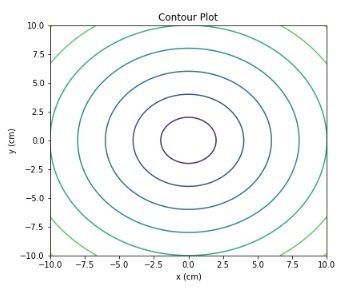
Nehmen wir ein weiteres Beispiel und zeichnen Konturlinien.
import numpy as np
import matplotlib.pyplot as plt

def f(x, y):
    return np.sqrt(X**2 + Y**2)

xlist = np.linspace(-10, 10, 400)
ylist = np.linspace(-10, 10, 400)

# create a mesh
X, Y = np.meshgrid(xlist, ylist)

Z = f(X, Y)

fig = plt.figure(figsize=(6,5))
ax = fig.add_axes([0.1, 0.1, 0.8, 0.8])

cp = ax.contour(X, Y, Z)
ax.set_title('Contour Plot')
ax.set_xlabel('x (cm)')
ax.set_ylabel('y (cm)')
plt.show()
Ausgabe

z-Funktion ist die Summe der Quadratwurzeln der x- und y-Koordinatenwerte. Implementiert mit der Funktion numpy.sqrt().
contourf()-Funktion
matplotlib.pyplot bietet eine Methode contextf() zum Zeichnen gefüllter Konturen. Hier ist die Syntax der Funktion -
contourf([X, Y,] Z, [levels], **kwargs)
Wo,
[X,Y]: Optionaler Parameter, der die Koordinate des Z-Medianwerts angibt.
Z: Der Höhenwert des gezeichneten Umrisses.
Ebenen: werden verwendet, um die Anzahl und Position von Konturlinien/-regionen zu bestimmen.
Beispiel
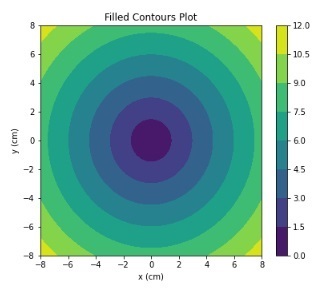
Nehmen wir ein weiteres Beispiel und verwenden Sie die Methode contextf(), um ein Konturdiagramm zu zeichnen.
import numpy as np
import matplotlib.pyplot as plt

xlist = np.linspace(-8, 8, 800)
ylist = np.linspace(-8, 8, 800)

X, Y = np.meshgrid(xlist, ylist)
Z = np.sqrt(X**2 + Y**2)

fig = plt.figure(figsize=(6,5))
ax = fig.add_axes([0.1, 0.1, 0.8, 0.8])

cp = ax.contourf(X, Y, Z)
fig.colorbar(cp) # Add a colorbar to a plot
ax.set_title('Filled Contours Plot')
#ax.set_xlabel('x (cm)')
ax.set_ylabel('y (cm)')
plt.show()
Ausgabe

Mit der Methode fig.colorbar() fügen wir dem Plot Farbe hinzu. Die z-Funktion ist die Summe der Quadratwurzeln der x- und y-Koordinatenwerte.
Beispiel
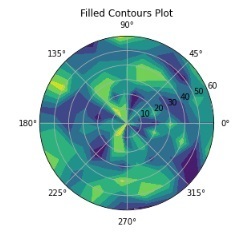
In diesem Beispiel zeichnen wir ein Polarkonturdiagramm mit der Methode matplotlib.plt.contourf().
import numpy as np
import matplotlib.pyplot as plt

a = np.radians(np.linspace(0, 360, 20))
b = np.arange(0, 70, 10)

Y, X = np.meshgrid(b, a)
values = np.random.random((a.size, b.size))

fig, ax = plt.subplots(subplot_kw=dict(projection='polar'))
ax.set_title('Filled Contours Plot')
ax.contourf(X, Y, values)

plt.show()
Ausgabe

In allen obigen Beispielen haben wir die Funktion numpy.meshgrid() verwendet, um Arrays von X- und Y-Koordinaten zu generieren.
Das obige ist der detaillierte Inhalt vonZeichnen Sie Konturdiagramme mit Python Matplotlib. Für weitere Informationen folgen Sie bitte anderen verwandten Artikeln auf der PHP chinesischen Website!

