
Heim >häufiges Problem >Tipps |. 6 häufig verwendete Kartenzeichnungsmethoden
Tipps |. 6 häufig verwendete Kartenzeichnungsmethoden

- Python当打之年nach vorne
- 2023-08-10 14:45:533225Durchsuche
Heute werde ich über verschiedene Kartenzeichnungsmethoden sprechen, die ich häufig in meiner täglichen Arbeit und meinem Leben verwende. Im Folgenden werde ich die Kartenzeichnungsmethoden der folgenden Visualisierungsbibliotheken vorstellen Karten gibt es auch. Es gibt viele ausgezeichnete Bibliotheken, es gibt keine Möglichkeit, sie alle aufzulisten. Lassen Sie uns die Boken-Methode zum Zeichnen von Karten vorstellen.
Zeichnen Sie eine Weltkarte Wir zeichnen es anhand der geografischen Daten von GEO. Die Karte ist auch sehr praktisch, aber die Karte sieht etwas eintönig aus. Lassen Sie uns verschiedene Provinzen in verschiedenen Farben zeichnen, um einen Blick darauf zu werfen. Sie können sehen, dass es bereits einen internen Geschmack gibt . Der einzige Fehler ist der 13. Abschnitt des Südchinesischen Meeres. Die Linie wird nicht angezeigt
geopandas
GeoPandas 是基于 Pandas 的地图可视化工具,其数据结构完全继承自 Pandas,对于熟悉潘大师的同学来说还是非常友好的
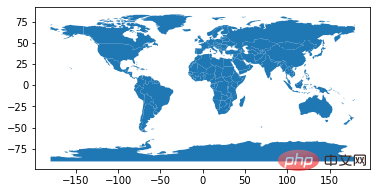
还是先画一张世界地图
import pandas as pd
import geopandas
import matplotlib.pyplot as plt
%matplotlib inline

world = geopandas.read_file(geopandas.datasets.get_path('naturalearth_lowres'))
world.plot()
plt.show()
这也是 geopandas 官网上的经典图片,可以看到非常简单,除去 import 代码,仅仅三行,就完成了地图的绘制
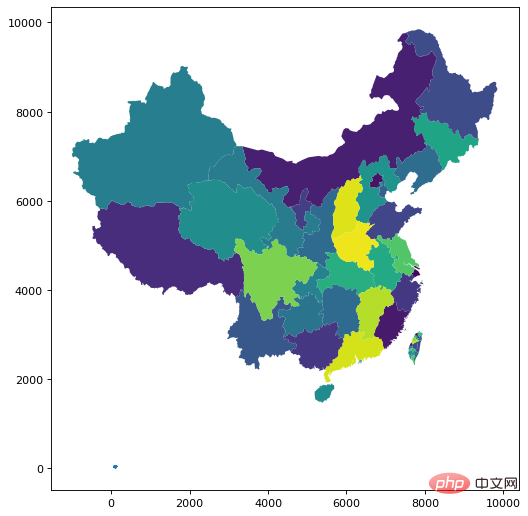
下面我们继续绘制中国地图,这次我们加上九段线信息
china_nine = geopandas.read_file(r"geojson/九段线GS(2019)1719号.geojson")
china = geopandas.read_file('china-new.json')
fig, ax = plt.subplots(figsize=(12, 8),dpi=80)
ax = china.plot(ax=ax, column='number')
ax = china_nine.plot(ax=ax)
plt.show()
我们复用了前面处理的 china.json 数据,里面的 number 字段是随机生成的测试数据,效果与 Bokeh 不相上下
plotly
接下来我们介绍 plotly,这也是一个非常好用的 Python 可视化工具,如果要绘制地图信息,我们需要安装如下依赖
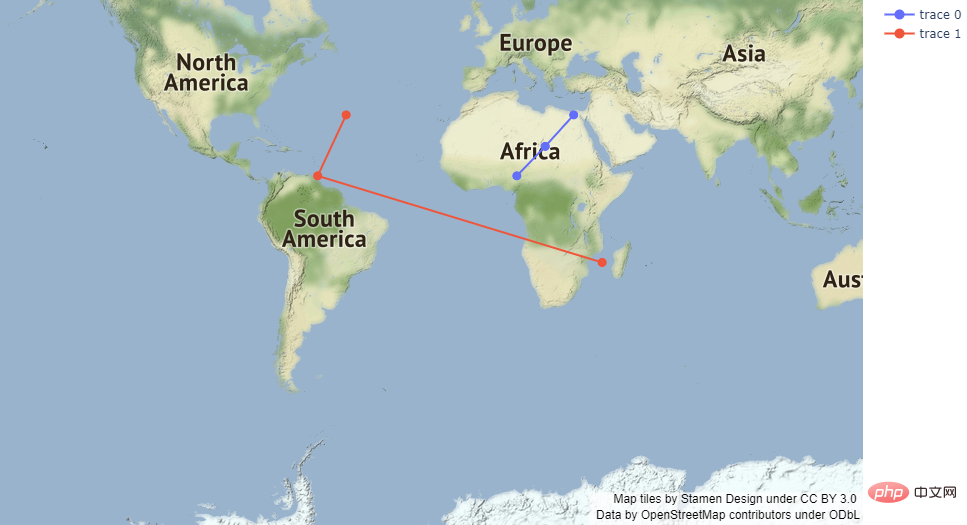
!pip install geopandas==0.3.0
!pip install pyshp==1.2.10
!pip install shapely==1.6.3
接下来我们先绘制一个世界地图
import plotly.graph_objects as go

fig = go.Figure(go.Scattermapbox(
    mode = "markers+lines",
    lon = [10, 20, 30],
    lat = [10, 20,30],
    marker = {'size': 10}))

fig.add_trace(go.Scattermapbox(
    mode = "markers+lines",
    lon = [-50, -60,40],
    lat = [30, 10, -20],
    marker = {'size': 10}))

fig.update_layout(
    margin ={'l':0,'t':0,'b':0,'r':0},
    mapbox = {
        'center': {'lon': 113.65000, 'lat': 34.76667},
        'style': "stamen-terrain",
        'center': {'lon': -20, 'lat': -20},
        'zoom': 1})

fig.show()
这里我们使用底层 API
plotly.graph_objects.Choroplethmapbox来绘制
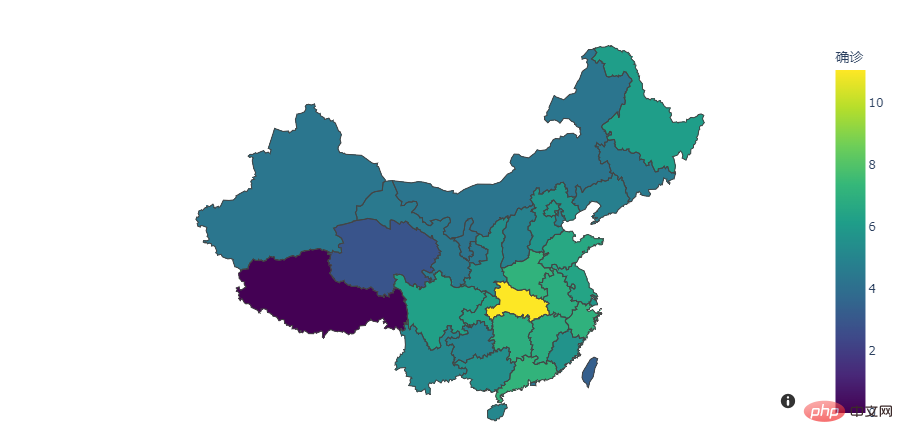
下面我们继续绘制中国地图,使用一个高级 API
plotly.express.choropleth_mapboximport pandas as pd import plotly.express as px import numpy as np import json with open(r"china_province.geojson", encoding='utf8') as f: provinces_map = json.load(f) df = pd.read_csv(r'data.csv') df.确诊 = df.确诊.map(np.log) fig = px.choropleth_mapbox( df, geojson=provinces_map, color='确诊', locations="地区", featureidkey="properties.NL_NAME_1", mapbox_style="carto-darkmatter", color_continuous_scale='viridis', center={"lat": 37.110573, "lon": 106.493924}, zoom=3, ) fig.show()
可以看出绘制出的交互式地图还是非常漂亮的,不过渲染速度有些感人,这个就看个人的需求了,如果你对渲染速度有要求,那么 Ployly 可能不是最好的选择~
Cartopy/Basemap
之所以把这两个库放到一起,是因为他们都是基于 Matplotlib 之上的,而随着 Python2 的不再维护,Basemap 也被 Matplotlib 放弃,Cartopy 随之转正,下面我们主要介绍 Cartopy 工具
Cartopy 利用了强大的 PROJ.4、NumPy 和 Shapely 库,并在 Matplotlib 之上构建了一个编程接口,用于创建发布高质量的地图
先来绘制一个世界地图
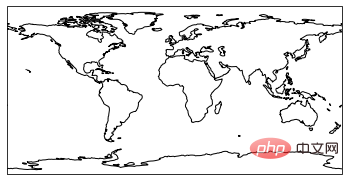
%matplotlib inline
import cartopy.crs as ccrs
import matplotlib.pyplot as plt

ax = plt.axes(projection=ccrs.PlateCarree())
ax.coastlines()

plt.show()
这是一个 cartopy 绘制的非常经典且常见的世界地图,形式比较简单,下面我们增强该地图
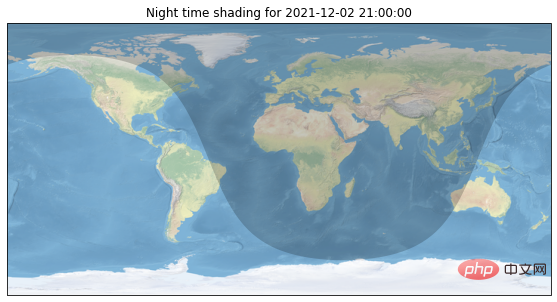
import datetime
import matplotlib.pyplot as plt
import cartopy.crs as ccrs
from cartopy.feature.nightshade import Nightshade


fig = plt.figure(figsize=(10, 5))
ax = fig.add_subplot(1, 1, 1, projection=ccrs.PlateCarree())

date = datetime.datetime(2021, 12, 2, 21)

ax.set_title(f'Night time shading for {date}')
ax.stock_img()
ax.add_feature(Nightshade(date, alpha=0.2))
plt.show()
我们通过上面的代码,绘制了当前时间世界昼夜图,还是很强的
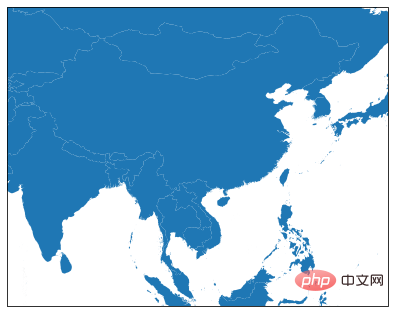
下面我们继续绘制中国地图
import cartopy.io.shapereader as shpreader
import numpy as np
import matplotlib.pyplot as plt
import cartopy.crs as ccrs
import cartopy.feature as cfeature
from cartopy.mpl.gridliner import LONGITUDE_FORMATTER, LATITUDE_FORMATTER
from cartopy.mpl.ticker import LongitudeFormatter, LatitudeFormatter
import cartopy.io.shapereader as shapereader
import matplotlib.ticker as mticker
#从文件中加载中国区域shp
shpfile = shapereader.Reader(r'ne_10m_admin_0_countries_chn\ne_10m_admin_0_countries_chn.shp')
# 设置 figure 大小
fig = plt.figure(figsize=[8, 5.5])
# 设置投影方式并绘制主图
ax = plt.axes(projection=ccrs.PlateCarree(central_longitude=180))
ax.add_geometries(
        shpfile.geometries(),
        ccrs.PlateCarree())
ax.set_extent([70, 140, 0, 55],crs=ccrs.PlateCarree())
plt.show()
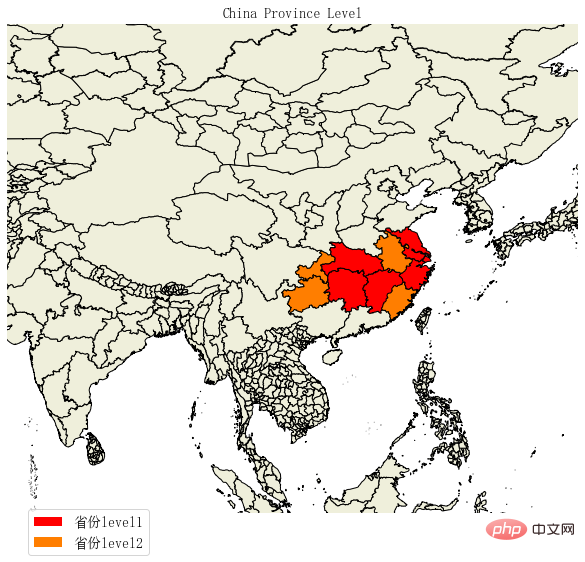
使用 cartopy 绘制地图最大的特点就是灵活度高,那么相对应的代价就是编写代码也会更难一些,比如如果想要给不同省份填充不同颜色,我们需要编写的代码就有点多
import matplotlib.patches as mpatches
import matplotlib.pyplot as plt
from matplotlib.font_manager import FontProperties
import shapely.geometry as sgeom

import cartopy.crs as ccrs
import cartopy.io.shapereader as shpreader

font = FontProperties(fname=r"c:\windows\fonts\simsun.ttc", size=14)

def sample_data():
#    lons = [110, 115, 120, 122, 124 ]
    lons = [124, 122, 120, 115, 110 ]
    lats = [33, 32, 28, 30, 28 ]
    return lons, lats

#ax = plt.axes([0, 0, 1, 1], projection=ccrs.LambertConformal())
ax = plt.axes(projection=ccrs.PlateCarree())


ax.set_extent([70, 140, 0, 55],crs=ccrs.Geodetic())

shapename = 'admin_1_states_provinces'
states_shp = shpreader.natural_earth(resolution='10m', category='cultural', name=shapename)


lons, lats = sample_data()

# to get the effect of having just the states without a map "background"
# turn off the outline and background patches
ax.background_patch.set_visible(False)
ax.outline_patch.set_visible(False)

plt.title(u'China Province Level', fontproperties=font)

# turn the lons and lats into a shapely LineString
track = sgeom.LineString(zip(lons, lats))

track_buffer = track.buffer(1)

for state in shpreader.Reader(states_shp).geometries():
    # pick a default color for the land with a black outline,
    # this will change if the storm intersects with our track
    facecolor = [0.9375, 0.9375, 0.859375]
    edgecolor = 'black'

    if state.intersects(track):
        facecolor = 'red'
    elif state.intersects(track_buffer):
        facecolor = '#FF7E00'

    ax.add_geometries([state], ccrs.PlateCarree(),
                      facecolor=facecolor, edgecolor=edgecolor)


# make two proxy artists to add to a legend
direct_hit = mpatches.Rectangle((0, 0), 1, 1, facecolor="red")
within_2_deg = mpatches.Rectangle((0, 0), 1, 1, facecolor="#FF7E00")
labels = [u'省份level1',
          '省份level2']
plt.legend([direct_hit, within_2_deg], labels,
           loc='lower left', bbox_to_anchor=(0.025, -0.1), fancybox=True, prop=font)
ax.figure.set_size_inches(14, 9)
plt.show()
folium
folium 是建立在 Python 生态系统的数据应用能力和 Leaflet.js 库的映射能力之上的高级地图绘制工具,通过 Python 操作数据,然后在 Leaflet 地图中可视化,可以灵活的自定义绘制区域,并且展现形式更加多样化
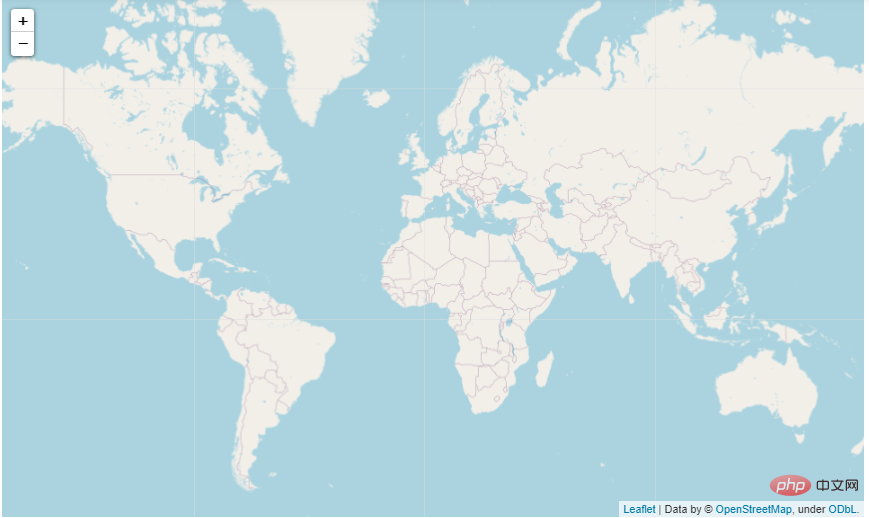
首先是三行代码绘制世界地图
import folium


# define the world map
world_map = folium.Map()
# display world map
world_map
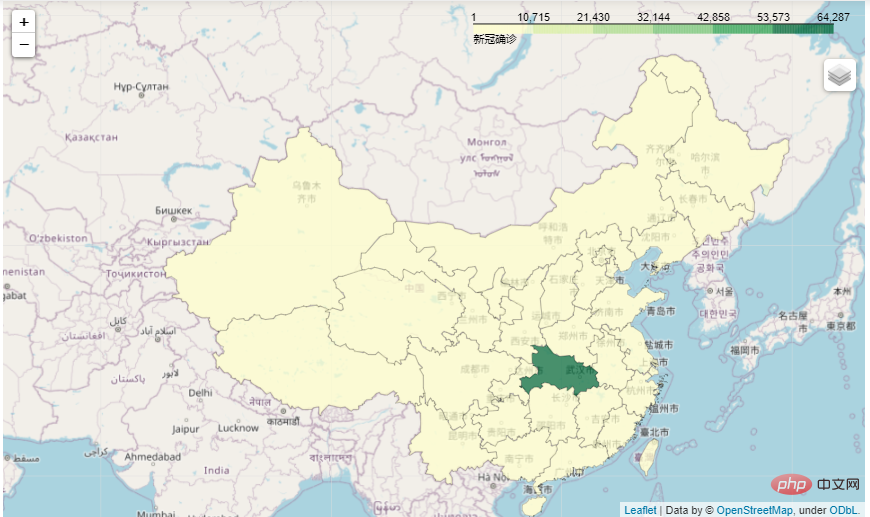
接下来绘制中国地图
# 绘制边界
import json

df = pd.read_csv(r'plotly-choropleth-mapbox-demo-master/data.csv')
# read china border
with open(r"plotly-choropleth-mapbox-demo-master/china_province.geojson", encoding='utf8') as f:
    china = json.load(f)

chn_map = folium.Map(location=[40, 100], zoom_start=4)


folium.Choropleth(
    geo_data=china,
    name="choropleth",
    data=df,
    columns=["地区", "确诊"],
    key_on="properties.NL_NAME_1",
    fill_color="YlGn",
    fill_opacity=0.7,
    line_opacity=0.2,
    legend_name="新冠确诊",
).add_to(chn_map)

folium.LayerControl().add_to(chn_map)

chn_map
作为专业地图工具,不仅渲染速度快,自定义程度也是非常高的,值得使用尝试
PyEcharts
最后我们介绍 PyEcharts,这款国产的精良可视化工具
绘制世界地图
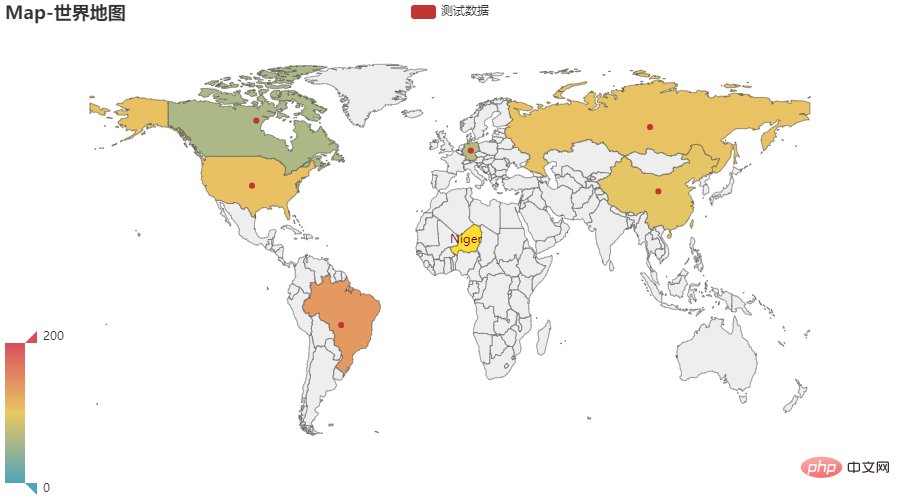
from pyecharts import options as opts
from pyecharts.charts import Map
from pyecharts.faker import Faker


c = (
    Map()
    .add("测试数据", [list(z) for z in zip(Faker.country, Faker.values())], "world")
    .set_series_opts(label_opts=opts.LabelOpts(is_show=False))
    .set_global_opts(
        title_opts=opts.TitleOpts(title="Map-世界地图"),
        visualmap_opts=opts.VisualMapOpts(max_=200),
    )
)
c.render_notebook()
通过 Pyecharts 绘制地图的一个好处就是不需要处理 GEO 文件,我们直接出入国家名称,就可以自动匹配到地图上,非常方便
再绘制中国地图
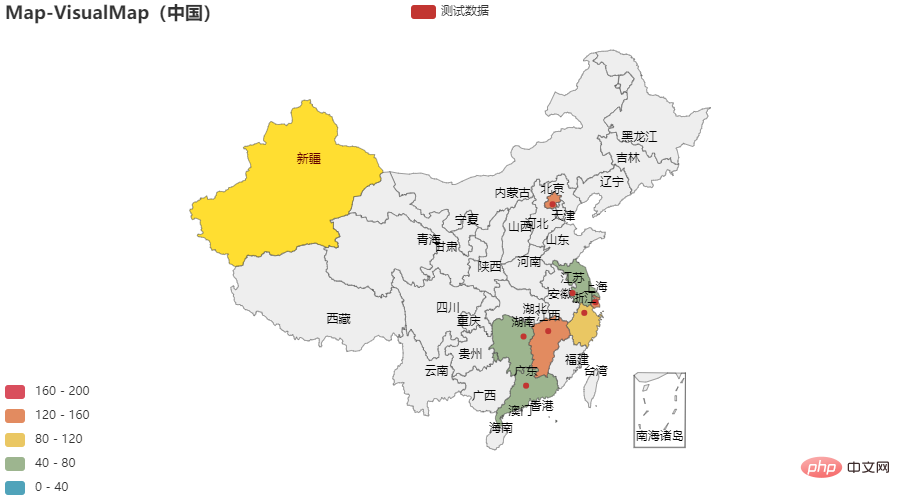
c = (
    Map()
    .add("测试数据", [list(z) for z in zip(Faker.provinces, Faker.values())], "china")
    .set_global_opts(
        title_opts=opts.TitleOpts(title="Map-VisualMap(中国)"),
        visualmap_opts=opts.VisualMapOpts(max_=200, is_piecewise=True),
    )
)
c.render_notebook()
我们只需要把参数替换成 ”china“ 就可方便的绘制中国地图,真的很给力,当然对于 Pyecharts 还有很多种玩法,就不一一介绍了
综合上面的示例,我们可以看出, Pyecharts 绘制地图最为简单,非常适合新手学习使用;而 folium 和 cartopy 则胜在自由度上,它们作为专业的地图工具,留给了使用者无限可能;至于 Plotly 和 Bokeh 则属于更高级的可视化工具,它们胜在画质更加优美,API 调用也更加完善
今天我们介绍了几种比较常用的绘制地图的类库,每一个工具都有其优缺点,我们只需要在选择的时候,明确目标,用心探索就好!
参考:https://gitee.com/kevinqqnj/cartopy_trial/blob/master/cartopy_province.py
https://zhuanlan.zhihu.com/p/112324234


Das obige ist der detaillierte Inhalt vonTipps |. 6 häufig verwendete Kartenzeichnungsmethoden. Für weitere Informationen folgen Sie bitte anderen verwandten Artikeln auf der PHP chinesischen Website!