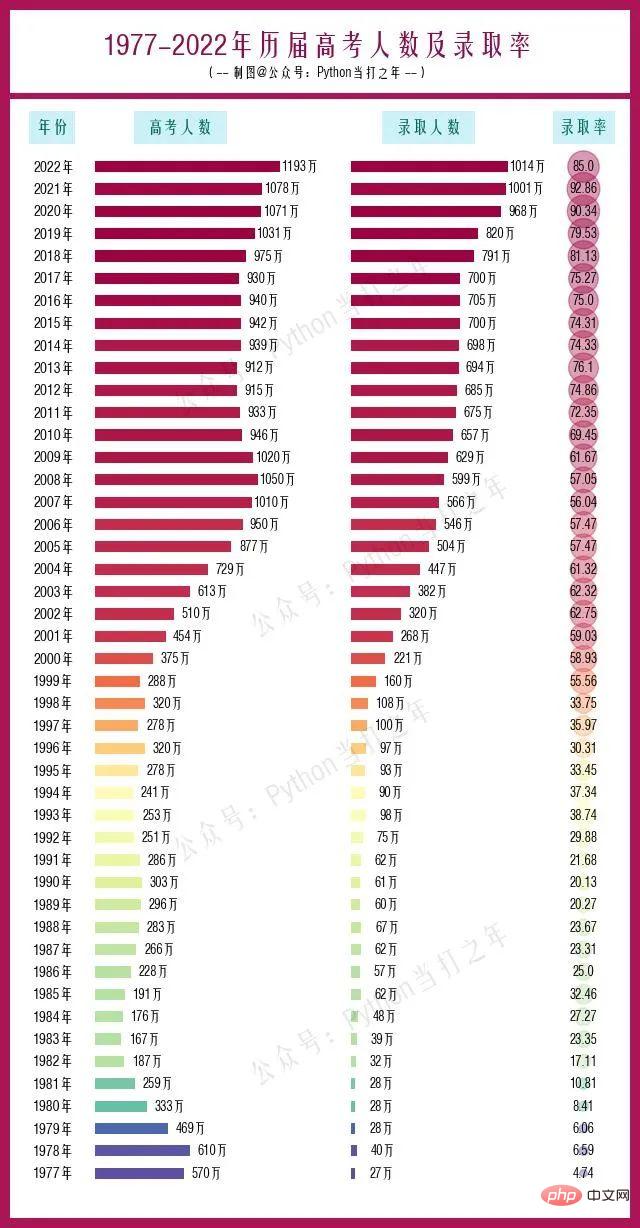
Heim >Backend-Entwicklung >Python-Tutorial >Python College-Aufnahmeprüfung |. matplotlib zeichnet das Verteilungsdiagramm der Anzahl der College-Aufnahmeprüfungen und Zulassungsquoten von 1977 bis 2022
Python College-Aufnahmeprüfung |. matplotlib zeichnet das Verteilungsdiagramm der Anzahl der College-Aufnahmeprüfungen und Zulassungsquoten von 1977 bis 2022
- Python当打之年nach vorne
- 2023-08-09 15:45:061725Durchsuche
2.1 绘制表头
ax.text(270, tit_pos, '年份', ha='center', va='bottom', fontsize=12, fontweight='heavy',color='#00695C')
ax.text(1100, tit_pos, '高考人数', ha='center', va='bottom', fontsize=12, fontweight='heavy',color='#00695C')
ax.text(2700, tit_pos, '录取人数', ha='center', va='bottom', fontsize=12, fontweight='heavy',color='#00695C')
ax.text(3700, tit_pos, '录取率', ha='center', va='bottom', fontsize=12, fontweight='heavy',color='#00695C')
2.2 绘制报考分数、录取人数条形图
years = df['年份'].values.tolist()
x = df['报考人数(人)'].values.tolist()
y = df['高校录取人数(人)'].values.tolist()
z = df['录取比例'].values.tolist()
ax.barh(years, x, left=550,tick_label=labels, height=0.5)
ax.barh(years, y, left=2200,tick_label=labels, height=0.5)
ax.scatter([3700]*len(z), years)
2.4 设置标题
ax.text(600, 50, '1977-2022年历届高考人数及录取率', fontdict={'color': '#880E4F', 'size': 20}, fontweight='heavy')
ax.text(1250, 49, '(-- 制图@公众号:Python当打之年 --)', fontsize = 9, fontweight='heavy',alpha=1)
Das obige ist der detaillierte Inhalt vonPython College-Aufnahmeprüfung |. matplotlib zeichnet das Verteilungsdiagramm der Anzahl der College-Aufnahmeprüfungen und Zulassungsquoten von 1977 bis 2022. Für weitere Informationen folgen Sie bitte anderen verwandten Artikeln auf der PHP chinesischen Website!
Stellungnahme:
Dieser Artikel ist reproduziert unter:Python当打之年. Bei Verstößen wenden Sie sich bitte an admin@php.cn löschen

