Heim >Backend-Entwicklung >Python-Tutorial >So nutzen Sie die Funktionen von Python folium
So nutzen Sie die Funktionen von Python folium
- WBOYWBOYWBOYWBOYWBOYWBOYWBOYWBOYWBOYWBOYWBOYWBOYWBnach vorne
- 2023-05-23 21:55:461716Durchsuche
1. Rendering
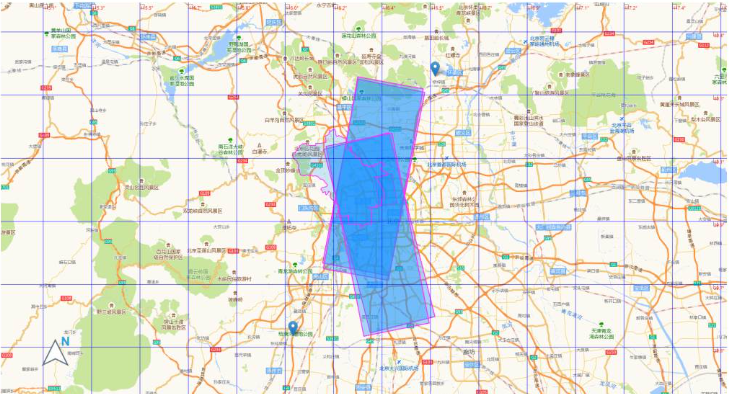
2. Ebenenkontrolle
Der Folium-Beamte stellt uns auch einige klarere Methoden zur Verfügung. Genau wie die Ebenensteuerung. Der offizielle Methodenname lautet FeatureGroup, und die Importmethode stammt von folium import FeatureGroup oder folium.FeatureGroup(). Ich gehe hier nicht näher auf die konkreten Prinzipien ein, sondern schaue mir hauptsächlich die Beispiele an:
import folium
def map2png(map_data,out_file='pdf.png'):
# 1.直接构造,默认底图
mo = folium.Map(location=[0, 0])
# 2.图层1-高德底图+数据
fg = folium.FeatureGroup()
# 2.1 高德地图
fg.add_child(folium.TileLayer(
tiles='http://webrd02.is.autonavi.com/appmaptile?lang=zh_cn&size=1&scale=1&style=8&x={x}&y={y}&z={z}',
attr="© <a href=http://ditu.amap.com/>高德地图</a>",
min_zoom=0,
max_zoom=19,
control=True,
zoom_control=False,
show=True))
# 2.2添加一个点
fg.add_child(folium.Marker(
location=[45.3311, -121.7113],
popup="Timberline Lodge",
icon=folium.Icon(color="green")))
# 2.3添加一个线形
fg.add_child(folium.PolyLine(
locations=[[38.68,115.67],
[38.85,115.48],
[38.65,115.37],
[38.68,115.67]],
color='green', weight=2, opacity=1))
# 2.4添加一个面
fg.add_child(folium.Polygon(
locations=[[38.68,115.67],
[38.85,115.48],
[38.65,115.37],
[38.68,115.67]],
color='green', weight=2,
fill=True,fill_color = 'red'))
# 2.5将我们的图层加入map
mo.add_child(fg)
# 3.图层2-重点数据+最上层
fg2 = folium.FeatureGroup()
fg2.add_child(folium.Polygon(
locations=[[38.68,115.67],
[38.85,115.48],
[38.65,115.37],
[38.68,115.67]],
color='green', weight=2,
fill=True,fill_color = 'red'))
mo.add_child(fg2)
# 4.将图层fg2显示在最上层,keep_in_front的参数必须是FeatureGroup或TileLayer对象
mo.keep_in_front(fg2)
# 5.根据范围缩放地图
mo.fit_bounds([[38.68,115.67],
[38.85,115.48],
[38.65,115.37],
[38.68,115.67]])
root = mo.get_root()
html = root.render() # 这个拿到的就是一个html的内容
# mo.save('text.html')3. Nordpfeil
Die Nordpfeilfunktion ist für die Karte nicht unbedingt notwendig, aber es ist immer gut, sie hinzuzufügen. Durch die Verwendung von FloatImage kann diese Funktion erreicht werden, obwohl der relevante Inhalt in der offiziellen Dokumentation und Quellcode-Analyse nicht erwähnt wird. Die offizielle Dokumentation enthält viele Plug-Ins. Das am weitesten verbreitete Plug-In ist die HeatMap-Methode namens Heatmap.
Die FloatImage-Methode implementiert die Platzierung eines Bildes auf dem Bildschirm und die Angabe der Größe des Bildes und der Position auf dem Bildschirm. Die Parameter sind Ganzzahlen (die FloatImage-Methode implementiert die prozentuale Konvertierung). Basierend auf dem zweiten Code haben wir das Bild in der unteren linken Ecke hinzugefügt.
fg.add_child(FloatImage(os.path.join(base, 'map_png', 'image', 'compass.png'), left=5, bottom=10, width=5))
4. JS und CSS zu Folium hinzufügen
folium bietet offiziell keine relevanten Methoden zum Hinzufügen von JS und CSS. Sie sollten auf der Grundlage der Interpretation des Quellcodes extrahiert werden . Fügen Sie js und css hinzu, um relevante Anweisungen zu erhalten.
Aus dem Quellcode ist ersichtlich, dass die Kartenfunktion in Folium über Jinjia2 implementiert wird, um HTML für Daten und Karten zu laden.
Es gibt drei Hauptmethoden zum Hinzufügen von Daten und Karten, die im Quellcode verwendet werden. Diese Methoden weisen Mängel auf (können nur vorne hinzugefügt werden). Wenn sie keine Operationen an Kartenobjekten beinhalten, können diese drei Methoden die Anforderungen erfüllen.
1.header fügt js und css hinzu
    init_script = """
        var mapsPlaceholder = [];
        L.Map.addInitHook(function () {mapsPlaceholder.push(this);});
    """
    # 加在header最上边
    mo.get_root().header.add_child(folium.Element(init_script))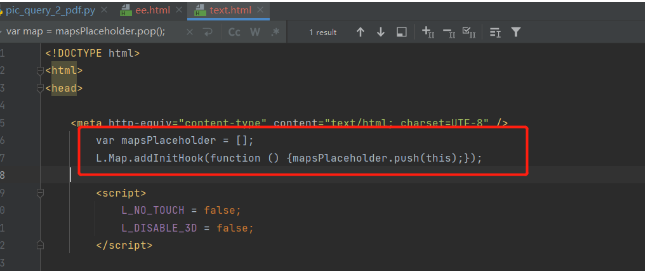
2.body fügt js und css hinzu
    init_script = """
        var mapsPlaceholder = [];
        L.Map.addInitHook(function () {mapsPlaceholder.push(this);});
    """
    # 加在body中
    mo.get_root().html.add_child(folium.Element(init_script))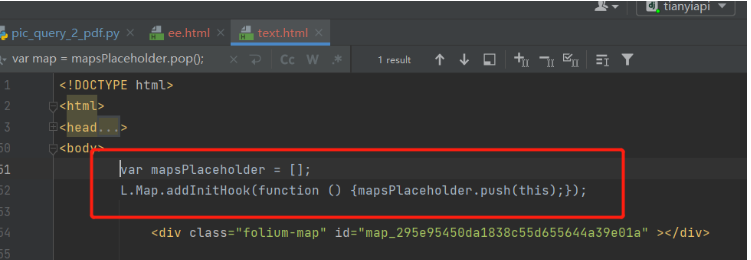
3.script fügt js und css hinzu
    init_script = """
        var mapsPlaceholder = [];
        L.Map.addInitHook(function () {mapsPlaceholder.push(this);});
    """
    # 加在script中
    mo.get_root().script.add_child(folium.Element(init_script))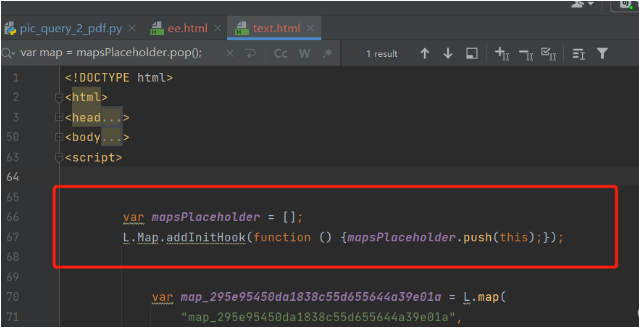
5. Längengrad und Breitengradgitterlinien
In einem Schritt wird die Methode zum Hinzufügen von js und css an verschiedenen Stellen der HTML-Datei implementiert. Wenn es sich um die Operation des Kartenobjekts handelt, kann es zu unbefriedigenden Situationen kommen, z. B. beim Hinzufügen von Längen- und Breitengradlinien. Es ist schwierig, die Funktion der Breiten- und Längengrade zu implementieren. Die Hauptschwierigkeiten sind:
1 Es gibt keine offiziellen entsprechenden Methoden und Plugins (derzeit keine).
2 Bibliothek, die auf Leadlet.js angewiesen ist, um Breiten- und Längengrade zu implementieren (im Internet wurde nur ein verwandter Artikel gefunden). direkte Back-End-Implementierungsmethode.
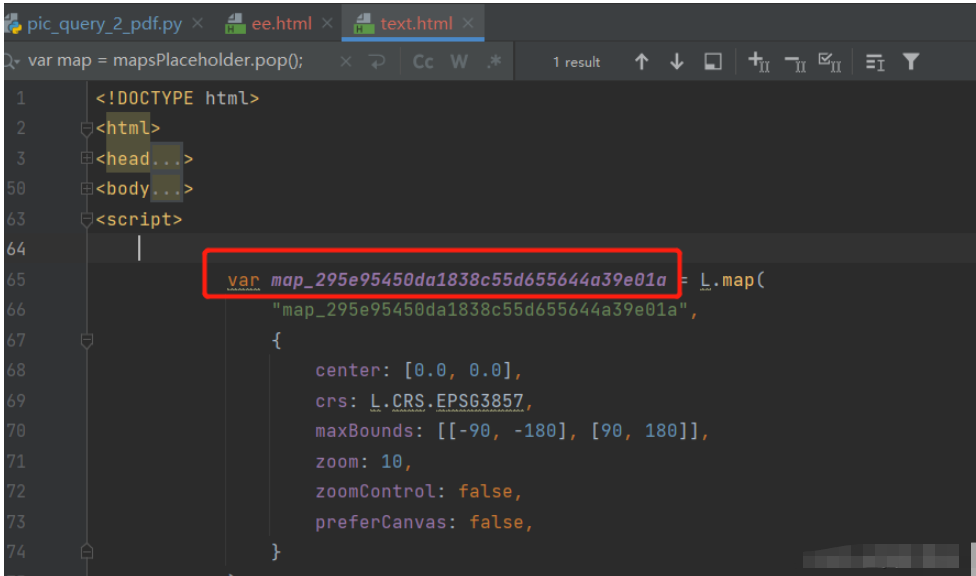
4. Die Front-End-Implementierungsmethode besteht darin, die Karte direkt zu erstellen. Hier ist das Kartenerstellungsobjekt nicht verfügbar (das Kartenobjekt wird zufällig generiert).
Wie bestimmt man die Gitterlinien für Breiten- und Längengrade?
Wir müssen das Objekt beim Erstellen des Kartenobjekts speichern, dann das Kartenobjekt abrufen und die Gitterlinien entsprechend der Zoomstufe implementieren. Eine wichtige Aufgabe besteht darin, sicherzustellen, dass der JavaScript-Code vor und nach der Erstellung des Kartenobjekts ordnungsgemäß in die HTML-Seite eingebettet wird.
Unter anderem wurde das Speichern des Objekts in vier Schritten beim Erstellen des Kartenobjekts implementiert. Durch das Studium des Folium-Quellcodes wurde die Methode zum Hinzufügen von js umgeschrieben, um js nach der Erstellung des Kartenobjekts hinzuzufügen.
 1.html-Seite zum Implementieren des Breiten- und Längengradgitters
<!DOCTYPE html>
<html lang="en">
<head>
<meta charset="UTF-8" />
<meta http-equiv="X-UA-Compatible" content="IE=edge" />
<meta name="viewport" content="width=device-width, initial-scale=1.0" />
<link
rel="stylesheet"
href="https://unpkg.com/leaflet@1.7.1/dist/leaflet.css" rel="external nofollow"
/>
<script src="https://unpkg.com/leaflet@1.7.1/dist/leaflet.js"></script>
<title>leaflet-经纬网格</title>
<style>
html,
body {
width: 100%;
height: 100%;
padding: 0;
margin: 0;
}
.leaflet-div-icon {
background: none;
border: none;
}
</style>
</head>
<body>
<div id="map" ></div>
<script>
let map = L.map("map", { renderer: L.canvas({ padding: 0.5 }) }).setView(
[25.127879288597576, 118.37905883789064],
4
);
// 添加背景图层
L.tileLayer("https://{s}.tile.openstreetmap.org/{z}/{x}/{y}.png", {
attribution:
'© <a href="https://www.openstreetmap.org/copyright" rel="external nofollow" >OpenStreetMap</a> contributors',
}).addTo(map);
// 创建图层
let lonLatGridLineLayer = L.featureGroup().addTo(map);
// 经纬网格生成方法
let addLonLatLine = () => {
let zoom = map.getZoom();
let bounds = map.getBounds();
let north = bounds.getNorth();
let east = bounds.getEast();
// 经纬度间隔
let d = 90 / Math.pow(2, zoom - 1);
// 经线网格
for (let index = -180; index <= 360; index += d) {
// 判断当前视野内
if (bounds.contains([north, index])) {
// 绘制经线
let lonLine = L.polyline(
[
[-90, index],
[90, index],
],
{ weight: 1, color: "blue" }
);
lonLatGridLineLayer.addLayer(lonLine);
// 标注
let text = index.toFixed(1) + "°";
// 动态计算小数位数
if (zoom > 10) {
text = index.toFixed((zoom - 8) / 2) + "°";
}
let divIcon = L.divIcon({
html: `<div >${text}</div>`,
iconAnchor: [0, -5],
});
let textMarker = L.marker([north, index], { icon: divIcon });
lonLatGridLineLayer.addLayer(textMarker);
}
}
if(d>90)d=90;
// 纬线网格
for (let index = -90; index <= 90; index += d) {
if (bounds.contains([index, east])) {
let lonLine = L.polyline(
[
[index, -180],
[index, 360],
],
{ weight: 1, color: "blue" }
);
lonLatGridLineLayer.addLayer(lonLine);
// 标注
let text = index.toFixed(1) + "°";
if (zoom > 10) {
text = index.toFixed((zoom - 8) / 2) + "°";
}
let divIcon = L.divIcon({
html: `<div >${text}</div>`,
iconAnchor: [(text.length + 1) * 6, 0],
});
let textMarker = L.marker([index, east], { icon: divIcon });
lonLatGridLineLayer.addLayer(textMarker);
}
}
};
addLonLatLine();
map.on("zoomend move", () => {
lonLatGridLineLayer.clearLayers();
addLonLatLine();
});
</script>
</body>
</html>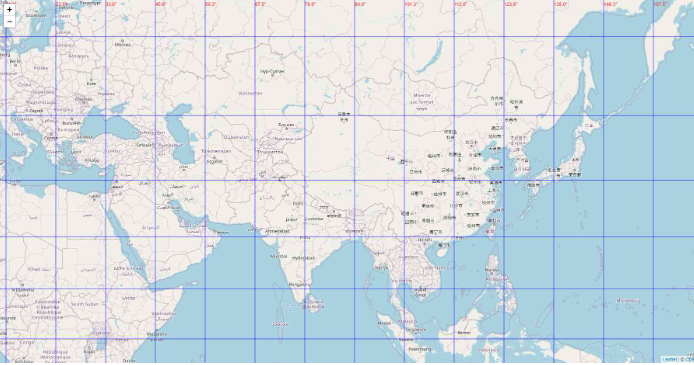 2. Passen Sie die Gitterlinienklasse an
Durch die Klassenvererbungsbeziehung des Quellcodes habe ich die MacroElement-Klasse geerbt.
from branca.element import MacroElement,
from jinja2 import Template
from folium.vector_layers import path_options
class Jwwg(MacroElement):
"""自定义经纬线网格"""
_template = Template("""
{% macro script(this, kwargs) %}
var map = mapsPlaceholder.pop();
// 创建图层
let lonLatGridLineLayer = L.featureGroup().addTo(map);
// 经纬网格生成方法
let addLonLatLine = () => {
let zoom = map.getZoom();
let bounds = map.getBounds();
let north = bounds.getNorth();
let east = bounds.getEast();
// 经纬度间隔
let d = 90 / Math.pow(2, zoom - 1);
// 经线网格
for (let index = -180; index <= 360; index += d) {
// 判断当前视野内
if (bounds.contains([north, index])) {
// 绘制经线
let lonLine = L.polyline(
[
[-90, index],
[90, index],
],
{weight: 1, color: "blue"}
);
lonLatGridLineLayer.addLayer(lonLine);
// 标注
let text = index.toFixed(1) + "°";
// 动态计算小数位数
if (zoom > 10) {
text = index.toFixed((zoom - 8) / 2) + "°";
}
let divIcon = L.divIcon({
html: `<div >${text}</div>`,
iconAnchor: [0, -5],
});
let textMarker = L.marker([north, index], {icon: divIcon});
lonLatGridLineLayer.addLayer(textMarker);
}
}
if (d > 90) d = 90;
// 纬线网格
for (let index = -90; index <= 90; index += d) {
if (bounds.contains([index, east])) {
let lonLine = L.polyline(
[
[index, -180],
[index, 360],
],
{weight: 1, color: "blue"}
);
lonLatGridLineLayer.addLayer(lonLine);
// 标注
let text = index.toFixed(1) + "°";
if (zoom > 10) {
text = index.toFixed((zoom - 8) / 2) + "°";
}
let divIcon = L.divIcon({
html: `<div >${text}</div>`,
iconAnchor: [(text.length + 1) * 6, 0],
});
let textMarker = L.marker([index, east], {icon: divIcon});
lonLatGridLineLayer.addLayer(textMarker);
}
}
};
addLonLatLine();
map.on("zoomend move", () => {
lonLatGridLineLayer.clearLayers();
addLonLatLine();
});
{% endmacro %}
""")
def __init__(self, **kwargs):
super(Jwwg, self).__init__()
self._name = 'Jwwg'
self.options = path_options(line=True, **kwargs)3. Rasterlinien implementieren
import folium
def map2png(map_data,out_file='pdf.png'):
# 1.直接构造,默认底图
mo = folium.Map(location=[0, 0])
# 2.图层1-高德底图+数据
fg = folium.FeatureGroup()
# 2.1 高德地图
fg.add_child(folium.TileLayer(
tiles='http://webrd02.is.autonavi.com/appmaptile?lang=zh_cn&size=1&scale=1&style=8&x={x}&y={y}&z={z}',
attr="© <a href=http://ditu.amap.com/>高德地图</a>",
min_zoom=0,
max_zoom=19,
control=True,
zoom_control=False,
show=True))
# 2.2添加一个点
fg.add_child(folium.Marker(
location=[45.3311, -121.7113],
popup="Timberline Lodge",
icon=folium.Icon(color="green")))
# 2.3添加一个线形
fg.add_child(folium.PolyLine(
locations=[[38.68,115.67],
[38.85,115.48],
[38.65,115.37],
[38.68,115.67]],
color='green', weight=2, opacity=1))
# 2.4添加一个面
fg.add_child(folium.Polygon(
locations=[[38.68,115.67],
[38.85,115.48],
[38.65,115.37],
[38.68,115.67]],
color='green', weight=2,
fill=True,fill_color = 'red'))
# 2.5将我们的图层加入map
mo.add_child(fg)
# 5.根据范围缩放地图
mo.fit_bounds([[38.68,115.67],
[38.85,115.48],
[38.65,115.37],
[38.68,115.67]])
# 网格线
init_script = """
var mapsPlaceholder = [];
L.Map.addInitHook(function () {mapsPlaceholder.push(this);});
"""
mo.get_root().script.add_child(folium.Element(init_script))
Jwwg().add_to(mo)
root = mo.get_root()
html = root.render() # 这个拿到的就是一个html的内容
# mo.save('text.html')Das obige ist der detaillierte Inhalt vonSo nutzen Sie die Funktionen von Python folium. Für weitere Informationen folgen Sie bitte anderen verwandten Artikeln auf der PHP chinesischen Website!

