Heim >Backend-Entwicklung >Python-Tutorial >So verwenden Sie Python zum Analysieren und Visualisieren von NetEase Cloud-Playlist-Daten
So verwenden Sie Python zum Analysieren und Visualisieren von NetEase Cloud-Playlist-Daten
- PHPznach vorne
- 2023-05-17 21:22:323594Durchsuche
Projektübersicht
1.1 Projektquelle
NetEase Cloud Music ist ein von NetEase entwickeltes Musikprodukt und ein Forschungsprojekt von NetEase Hangzhou Die Ergebnisse der Akademie basieren auf professionellen Musikern, DJs, Empfehlungen von Freunden und sozialen Funktionen. Der Online-Musikdienst konzentriert sich auf Wiedergabelisten, soziale Netzwerke, Empfehlungen großer Namen und Musik-Fingerabdrücke mit Wiedergabelisten, DJ-Programmen, sozialen Netzwerken und geografischen Standorten Die Kernelemente konzentrieren sich auf das Entdecken und Teilen. Crawlen Sie den Playlist-Teil der offiziellen Website von NetEase Cloud Music, rufen Sie Daten aus der NetEase Cloud Music-Playlist ab, rufen Sie alle Playlists eines bestimmten Songstils ab und rufen Sie den Namen, das Tag, die Einleitung, die Sammlungslautstärke, die Wiedergabelautstärke und die Songliste ab die Playlist. Die Anzahl der in der Single enthaltenen Songs sowie die Anzahl der Kommentare.
1.2Anforderung. Beschreibung#🎜 🎜 #
Verarbeiten Sie die gecrawlten Daten vor, analysieren Sie die vorverarbeiteten Daten und analysieren Sie die Anzahl der Playlists, Sammlungen, Kommentare und die Sammlung von Songs in der Playlist, Playlist-Tags, Playlist-Mitwirkenden usw. werden analysiert und visualisiert, um die Analyseergebnisse intuitiver wiederzugeben. Datenerfassung2.1 Auswahl der Datenquellen
Musik hören Musik ist für viele junge Menschen ein Weg Heute ist NetEase Cloud Music eine beliebte Musikplattform, um die Probleme, mit denen junge Menschen in der heutigen Gesellschaft konfrontiert sind, zu verstehen Verstehen Sie auch die Vorlieben der Benutzer, analysieren Sie, welche Art von Songliste beim Publikum am beliebtesten ist, und können Sie auch die Vorlieben des Publikums widerspiegeln, was auch bei der Erstellung von Musikschaffenden eine sehr wichtige Rolle spielt. Aus der Sicht normaler Benutzer erleichtert die Erstellung von Playlists einerseits die Klassifizierung und Verwaltung ihrer eigenen Sammlung von Musikbibliotheken. Andererseits kann die Erstellung hochwertiger Playlists ihren eigenen Musikgeschmack hervorheben und Kommentare geben Ihnen ein großes Erfolgserlebnis und Zufriedenheit. „Playlist“-Musikhören ist für Verbraucher sehr wichtig und kann das Hörerlebnis des Nutzers deutlich verbessern. Für Musiker, Radiomoderatoren und andere Arten von Playlist-Erstellern können „Playlists“ ihre Musik und Werke besser verbreiten und auch besser mit Fans interagieren und ihre Popularität steigern. Dieses Projekt crawlt Daten aus dem chinesischen Playlist-Teil der offiziellen Website von NetEase Cloud. Die Crawling-Adresse lautet: Chinesische Playlist – Playlist – NetEase Cloud Music #🎜 🎜#2.2 Daten Erwerb2.2.1 DesignBetreten Sie jede Seite und rufen Sie jede Songliste auf Geben Sie auf der Seite eine einzelne Songliste ein, der Name der Songliste, der Sammlungsumfang, die Anzahl der Kommentare, Tags, die Einleitung, die Gesamtzahl der Songs, die Wiedergabelautstärke, die enthaltenen Songtitel und andere Daten werden alle im selben Div der Webseite gespeichert Wählen Sie darin jeden Inhalt über den Selektor-Selektor aus.
2.2.2 Umsetzungfrom bs4 import BeautifulSoup
import requests
import time
headers = {
'User-Agent': 'Mozilla/5.0 (Windows NT 6.1; WOW64) AppleWebKit/537.36 (KHTML, like Gecko) Chrome/63.0.3239.132 Safari/537.36'
}
for i in range(0, 1330, 35):
print(i)
time.sleep(2)
url = 'https://music.163.com/discover/playlist/?cat=华语&order=hot&limit=35&offset=' + str(i)#修改这里即可
response = requests.get(url=url, headers=headers)
html = response.text
soup = BeautifulSoup(html, 'html.parser')
# 获取包含歌单详情页网址的标签
ids = soup.select('.dec a')
# 获取包含歌单索引页信息的标签
lis = soup.select('#m-pl-container li')
print(len(lis))
for j in range(len(lis)):
# 获取歌单详情页地址
url = ids[j]['href']
# 获取歌单标题
title = ids[j]['title']
# 获取歌单播放量
play = lis[j].select('.nb')[0].get_text()
# 获取歌单贡献者名字
user = lis[j].select('p')[1].select('a')[0].get_text()
# 输出歌单索引页信息
print(url, title, play, user)
# 将信息写入CSV文件中
with open('playlist.csv', 'a+', encoding='utf-8-sig') as f:
f.write(url + ',' + title + ',' + play + ',' + user + '\n')
from bs4 import BeautifulSoup
import pandas as pd
import requests
import time
df = pd.read_csv('playlist.csv', header=None, error_bad_lines=False, names=['url', 'title', 'play', 'user'])
headers = {
'User-Agent': 'Mozilla/5.0 (Windows NT 6.1; WOW64) AppleWebKit/537.36 (KHTML, like Gecko) Chrome/63.0.3239.132 Safari/537.36'
}
for i in df['url']:
time.sleep(2)
url = 'https://music.163.com' + i
response = requests.get(url=url, headers=headers)
html = response.text
soup = BeautifulSoup(html, 'html.parser')
# 获取歌单标题
title = soup.select('h3')[0].get_text().replace(',', ',')
# 获取标签
tags = []
tags_message = soup.select('.u-tag i')
for p in tags_message:
tags.append(p.get_text())
# 对标签进行格式化
if len(tags) > 1:
tag = '-'.join(tags)
else:
tag = tags[0]
# 获取歌单介绍
if soup.select('#album-desc-more'):
text = soup.select('#album-desc-more')[0].get_text().replace('\n', '').replace(',', ',')
else:
text = '无'
# 获取歌单收藏量
collection = soup.select('#content-operation i')[1].get_text().replace('(', '').replace(')', '')
# 歌单播放量
play = soup.select('.s-fc6')[0].get_text()
# 歌单内歌曲数
songs = soup.select('#playlist-track-count')[0].get_text()
# 歌单评论数
comments = soup.select('#cnt_comment_count')[0].get_text()
# 输出歌单详情页信息
print(title, tag, text, collection, play, songs, comments)
# 将详情页信息写入CSV文件中
with open('music_message.csv', 'a+', encoding='utf-8') as f:
# f.write(title + '/' + tag + '/' + text + '/' + collection + '/' + play + '/' + songs + '/' + comments + '\n')
f.write(title + ',' + tag + ',' + text + ',' + collection + ',' + play + ',' + songs + ',' + comments + '\n')
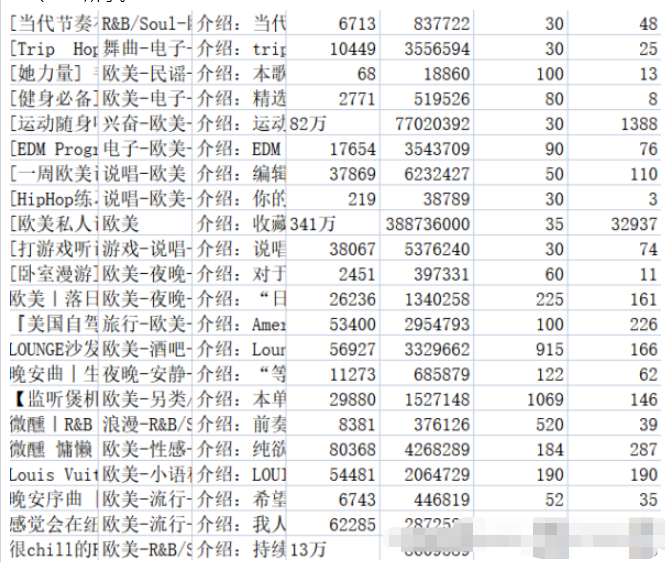
2.2.3 Wirkung# 🎜🎜# Speichern Sie den relevanten Inhalt in der entsprechenden CSV-Datei. In der Datei „music_message.csv“ werden Name, Tag, Einleitung, Sammlungslautstärke, Wiedergabelautstärke und die Anzahl der Songs gespeichert in die Playlist aufgenommen und die Anzahl der Kommentare. Adresse, Titel, Wiedergabelautstärke und Name des Mitwirkenden der Playlist-Detailseite werden alle in der Datei playlist.csv gespeichert. Die Ergebnisse sind in den Abbildungen 2-1 und 2-2 dargestellt.
Datenvorverarbeitung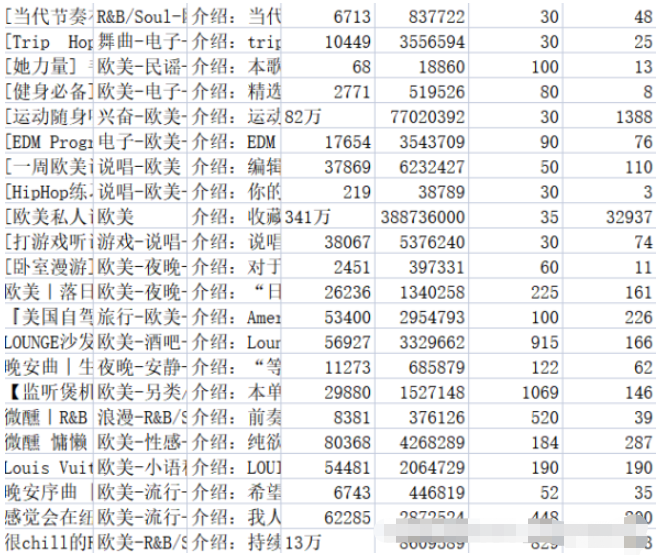
3.1 Design
Fügen Sie „10.000“ Daten zur Anzahl der Kommentare hinzu und ersetzen Sie „10.000“ durch „0000“, um nachfolgende Daten zu erleichtern Zur Analyse werden die Daten mit statistischen Fehlern in der Anzahl der Kommentare mit „0“ gefüllt und fließen nicht in die Folgestatistik ein.
3.2 Realisierung
df['collection'] = df['collection'].astype('string').str.strip()
df['collection'] = [int(str(i).replace('万','0000')) for i in df['collection']]
df['text'] = [str(i)[3:] for i in df['text']]
df['comments'] = [0 if '评论' in str(i).strip() else int(i) for i in df['comments']]
3.3 Wirkung
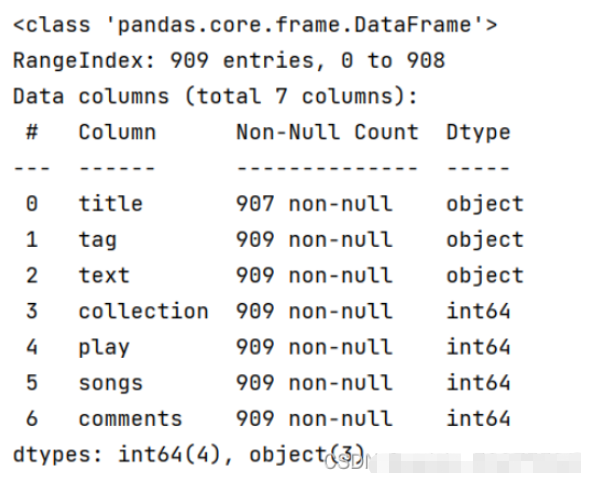
#🎜 🎜# # ?? 🎜 #4.1.2 Ergebnisse
#🎜 🎜## 🎜🎜#4.2 Top 10 Playlist-Sammlungen
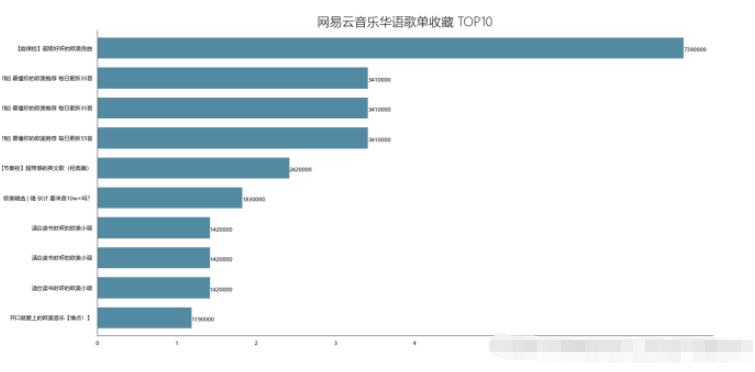
4.2.1 Realisierung
df_play = df[['title','play']].sort_values('play',ascending=False)
df_play[:10]
df_play = df_play[:10]
_x = df_play['title'].tolist()
_y = df_play['play'].tolist()
df_play = get_matplot(x=_x,y=_y,chart='barh',title='网易云音乐华语歌单播放 TOP10',ha='left',size=8,color=color[0])
df_play
4.2.2 Ergebnisse
# 🎜🎜## 🎜🎜#
4.2.3 可视化
4.3 歌单评论数Top10
4.3.1 实现
df_com = df[['title','comments']].sort_values('comments',ascending=False)
df_com[:10]
df_com = df_com[:10]
_x = df_com['title'].tolist()
_y = df_com['comments'].tolist()
df_com = get_matplot(x=_x,y=_y,chart='barh',title='网易云音乐华语歌单评论数 TOP10',ha='left',size=8,color=color[2])
df_com
4.3.2 结果
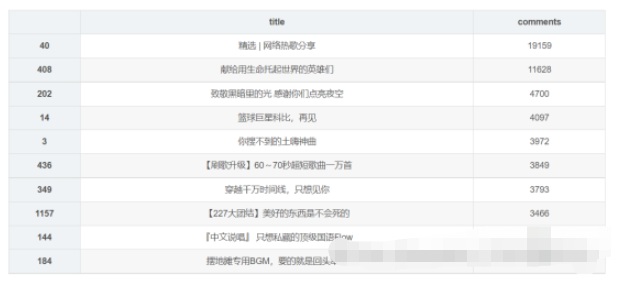
4.3.3 可视化
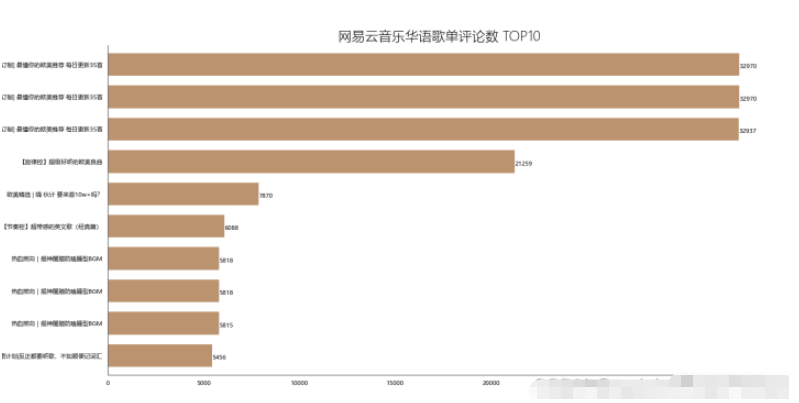
4.4 歌单歌曲收录情况分布
4.4.1 实现
df_songs = np.log(df['songs'])
df_songs
df_songs = get_matplot(x=0,y=df_songs,chart='hist',title='华语歌单歌曲收录分布情况',ha='left',size=10,color=color[3])
df_songs
4.4.2 效果及可视化
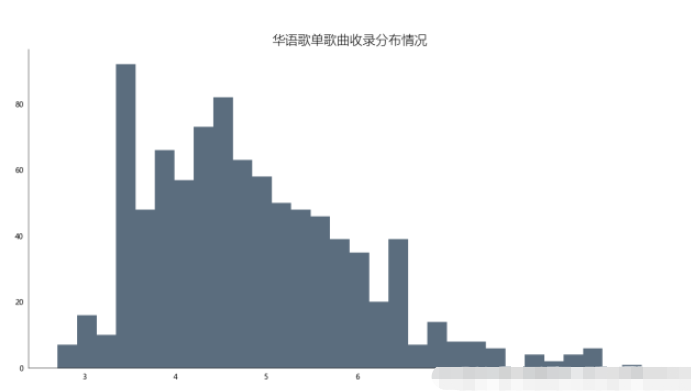
4.4.3 分析
通过对柱形图分析发现,歌单对歌曲的收录情况多数集中在20-60首歌曲,至多超过80首,也存在空歌单现象,但绝大多数歌单收录歌曲均超过10首左右。这次可视化分析将有助于后续创作者更好地收录歌曲到自己的创作歌单中。也能够更受大众欢迎。
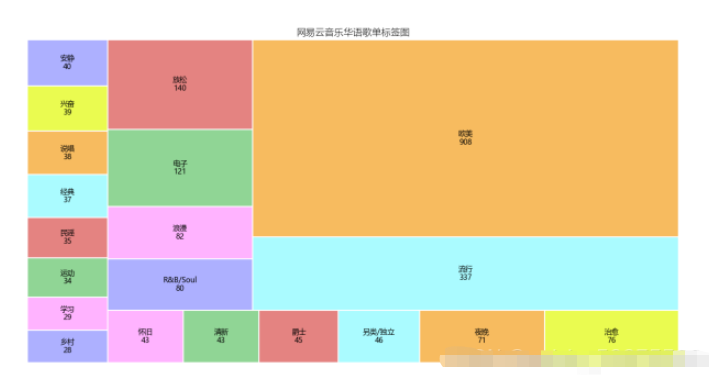
4.5 歌单标签图
4.5.1 实现
def get_tag(df):
    df = df['tag'].str.split('-')
    datalist = list(set(x for data in df for x in data))
    return  datalist
df_tag = get_tag(df)
# df_tag
def get_lx(x,i):
    if i in str(x):
        return 1
    else:
        return 0
for i in list(df_tag):#这里的df['all_category'].unique()也可以自己用列表构建,我这里是利用了前面获得的
    df[i] = df['tag'].apply(get_lx,i=f'{i}')
# df.head()
Series = df.iloc[:,7:].sum().sort_values(0,ascending=False)
df_tag = [tag for tag in zip(Series.index.tolist(),Series.values.tolist())]
df_tag[:10]
df_iex = [index for index in Series.index.tolist()][:20]
df_tag = [tag for tag in Series.values.tolist()][:20]
df_tagiex = get_matplot(x=df_iex,y=df_tag,chart='plot',title='网易云音乐华语歌单标签图',size=10,ha='center',color=color[3])
df_tagiex
4.5.2 结果
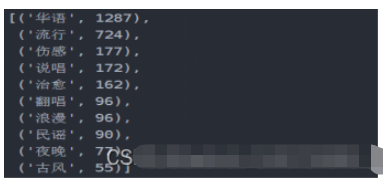
4.5.3 可视化
4.5.4 分析
可以通过此标签图看出歌单的风格,可以分析出目前的主流歌曲的情感,以及大众的需求,也网易云音乐用户的音乐偏好,据此可以看出,网易云音乐用户,在音乐偏好上比较多元化:国内流行、欧美流行、电子、 等各种风格均有涉及。
4.6 歌单贡献up主Top10
4.6.1 实现
df_user = pd.read_csv('playlist.csv',encoding="unicode_escape",header=0,names=['url','title','play','user'],sep=',')
df_user.shape
df_user = df_user.iloc[:,1:]
df_user['count'] = 0
df_user = df_user.groupby('user',as_index=False)['count'].count()
df_user = df_user.sort_values('count',ascending=False)[:10]
df_user
df_user = df_user[:10]
names = df_user['user'].tolist()
nums = df_user['count'].tolist()
df_u = get_matplot(x=names,y=nums,chart='barh',title='歌单贡献UP主 TOP10',ha='left',size=10,color=color[4])
df_u
4.6.2 结果
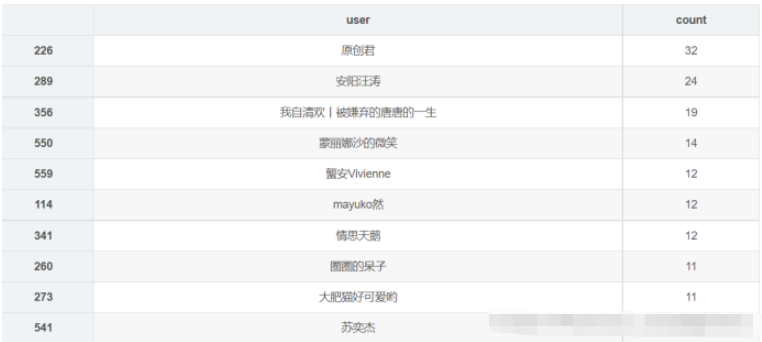
4.6.3 可视化
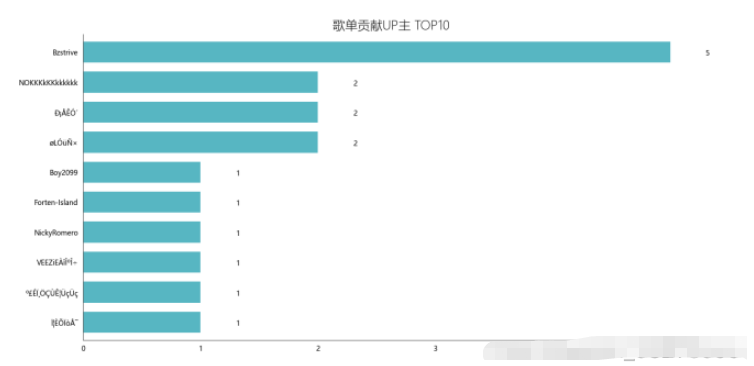
4.7歌单名生成词云
4.7.1 实现
import wordcloud
import pandas as pd
import numpy as np
from PIL import Image
data = pd.read_excel('music_message.xlsx')
#根据播放量排序,只取前五十个
data = data.sort_values('play',ascending=False).head(50)

#font_path指明用什么样的字体风格,这里用的是电脑上都有的微软雅黑
w1 = wordcloud.WordCloud(width=1000,height=700,
                         background_color='black',
                         font_path='msyh.ttc')
txt = "\n".join(i for i in data['title'])
w1.generate(txt)
w1.to_file('F:\\词云.png')
4.7.2 结果及可视化
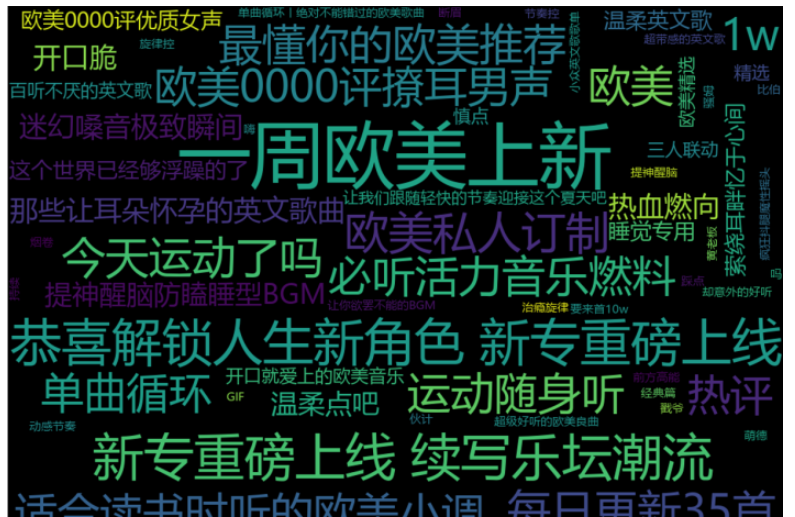
4.8 代码实现
为了简化代码,构建了通用函数
get_matplot(x,y,chart,title,ha,size,color)
x表示充当x轴数据;
y表示充当y轴数据;
chart表示图标类型,这里分为三种barh、hist、squarify.plot;
ha表示文本相对朝向;
size表示字体大小;
color表示图表颜色;
def get_matplot(x,y,chart,title,ha,size,color):
    # 设置图片显示属性,字体及大小
    plt.rcParams['font.sans-serif'] = ['Microsoft YaHei']
    plt.rcParams['font.size'] = size
    plt.rcParams['axes.unicode_minus'] = False
    # 设置图片显示属性
    fig = plt.figure(figsize=(16, 8), dpi=80)
    ax = plt.subplot(1, 1, 1)
    ax.patch.set_color('white')
    # 设置坐标轴属性
    lines = plt.gca()
    # 设置显示数据
    if x ==0:
        pass
    else:
        x.reverse()
        y.reverse()
        data = pd.Series(y, index=x)
    # 设置坐标轴颜色
    lines.spines['right'].set_color('none')
    lines.spines['top'].set_color('none')
    lines.spines['left'].set_color((64/255, 64/255, 64/255))
    lines.spines['bottom'].set_color((64/255, 64/255, 64/255))
    # 设置坐标轴刻度
    lines.xaxis.set_ticks_position('none')
    lines.yaxis.set_ticks_position('none')
    if chart == 'barh':
        # 绘制柱状图,设置柱状图颜色
        data.plot.barh(ax=ax, width=0.7, alpha=0.7, color=color)
        # 添加标题,设置字体大小
        ax.set_title(f'{title}', fontsize=18, fontweight='light')
        # 添加歌曲出现次数文本
        for x, y in enumerate(data.values):
            plt.text(y+0.3, x-0.12, '%s' % y, ha=f'{ha}')
    elif chart == 'hist':
        # 绘制直方图,设置柱状图颜色
        ax.hist(y, bins=30, alpha=0.7, color=(21/255, 47/255, 71/255))
        # 添加标题,设置字体大小
        ax.set_title(f'{title}', fontsize=18, fontweight='light')
    elif chart == 'plot':
        colors = ['#adb0ff', '#ffb3ff', '#90d595', '#e48381', '#aafbff', '#f7bb5f', '#eafb50',
         '#adb0ff', '#ffb3ff', '#90d595', '#e48381', '#aafbff', '#f7bb5f', '#eafb50',
         '#adb0ff', '#ffb3ff', '#90d595', '#e48381', '#aafbff', '#f7bb5f', '#eafb50',
         '#adb0ff', '#ffb3ff', '#90d595', '#e48381', '#aafbff', '#f7bb5f', '#eafb50',
         '#adb0ff', '#ffb3ff', '#90d595', '#e48381', '#aafbff', '#f7bb5f', '#eafb50',
          '#adb0ff', '#ffb3ff', '#90d595', '#e48381', '#aafbff', '#f7bb5f', '#eafb50',
          '#adb0ff', '#ffb3ff', '#90d595', '#e48381', '#aafbff']
        plot = squarify.plot(sizes=y, label=x, color=colors, alpha=1, value=y, edgecolor='white', linewidth=1.5)
        # 设置标签大小为1
        plt.rc('font', size=6)
        # 设置标题大小
        plot.set_title(f'{title}', fontsize=13, fontweight='light')
        # 除坐标轴
        plt.axis('off')
        # 除上边框和右边框刻度
        plt.tick_params(top=False, right=False)
    # 显示图片
    plt.show()
#构建color序列
color = [(153/255, 0/255, 102/255),(8/255, 88/255, 121/255),(160/255, 102/255, 50/255),(136/255, 43/255, 48/255),(16/255, 152/255, 168/255),(153/255, 0/255, 102/255)]
Das obige ist der detaillierte Inhalt vonSo verwenden Sie Python zum Analysieren und Visualisieren von NetEase Cloud-Playlist-Daten. Für weitere Informationen folgen Sie bitte anderen verwandten Artikeln auf der PHP chinesischen Website!

