Heim >Backend-Entwicklung >Python-Tutorial >So fügen Sie Beschriftungen zu Matplotlib-Bildern in Python hinzu
So fügen Sie Beschriftungen zu Matplotlib-Bildern in Python hinzu
- 王林nach vorne
- 2023-05-12 12:52:064760Durchsuche
1. Textbeschriftung hinzufügen plt.text()
wird verwendet, um während des Zeichenvorgangs Text an der angegebenen Koordinatenposition auf dem Bild hinzuzufügen. Was verwendet werden muss, ist die Methode plt.text().
Seine Hauptparameter sind drei:
plt.text(x, y, s)
wobei x und y die x- und y-Achsenkoordinaten des eingehenden Punkts darstellen. s stellt eine Zeichenfolge dar.
Es ist zu beachten, dass sich die Koordinaten hier, wenn Xticks- und Yticks-Beschriftungen festgelegt sind, nicht auf die Beschriftungen beziehen, sondern auf die ursprünglichen Werte der x- und Achsen beim Zeichnen.
Da es zu viele Parameter gibt, werde ich sie nicht einzeln erklären. Lernen Sie ihre Verwendung anhand des Codes.
ha = 'center’ bedeutet, dass die vertikale Ausrichtung zentriert ist, fontsize = 30 bedeutet, dass die Schriftgröße 30 ist, rotation = - 25 gibt an, dass der Drehwinkel -25 Grad beträgt. <code>c legt die Farbe fest und alpha legt die Transparenz fest. va steht für die horizontale Ausrichtung. ha = 'center’表示垂直对齐方式居中,fontsize = 30表示字体大小为30,rotation = -25表示旋转的角度为-25度。c 设定颜色,alpha设定透明度。va表示水平对齐方式。
1. 示例
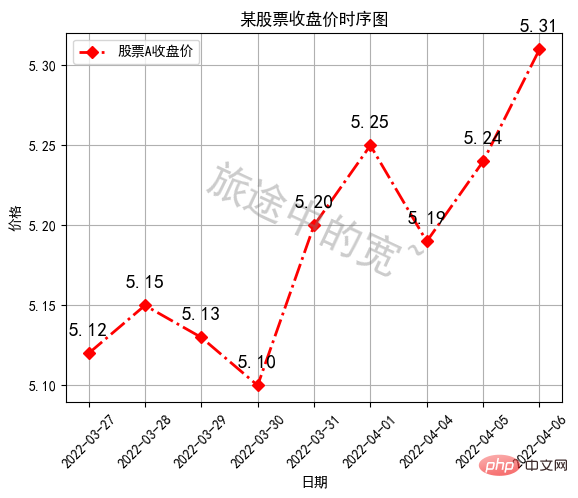
代码在图像中添加了两段文本,一段是“旅途中的宽~”的斜体水印,透明度为0.4。
另一段是在折线的每个折点附近标出当天收盘价。
import matplotlib.pyplot as plt
plt.rcParams['font.sans-serif'] = ['SimHei']
plt.rcParams['axes.unicode_minus'] = False
x = range(9)
y = [5.12, 5.15, 5.13, 5.10, 5.2, 5.25, 5.19, 5.24, 5.31]
c = 0.5 * (min(x) + max(x))
d = min(y) + 0.3 * (max(y) - min(y))
# 水印效果
plt.text(c, d, '旅途中的宽~', ha = 'center', fontsize = 30, rotation = -25, c = 'gray', alpha = 0.4)
plt.plot(x, y, label = '股票A收盘价', c = 'r', ls = '-.', marker = 'D', lw = 2)
plt.xticks(x, [
	'2022-03-27', '2022-03-28', '2022-03-29', '2022-03-30',
	'2022-03-31', '2022-04-01', '2022-04-04', '2022-04-05',
	'2022-04-06'], rotation = 45)
plt.title('某股票收盘价时序图')
plt.xlabel('日期')
plt.ylabel('价格')
plt.grid(True)
plt.legend()
# 标出每天的收盘价
for a, b in zip(x, y):
	plt.text(a, b + 0.01, '%.2f' % b, ha = 'center', va = 'bottom', fontsize = 14)
plt.show()
二、添加注释 plt.annotate()
在上例代码的基础之上,添加注释。注释即对图像中某一位置的解释,可以用箭头来指向。
添加注释使用的是plt.annotate()方法
其语法中的常用参数如下
plt.annotate(str,xy,xytext,xycoords,arrowcoords)
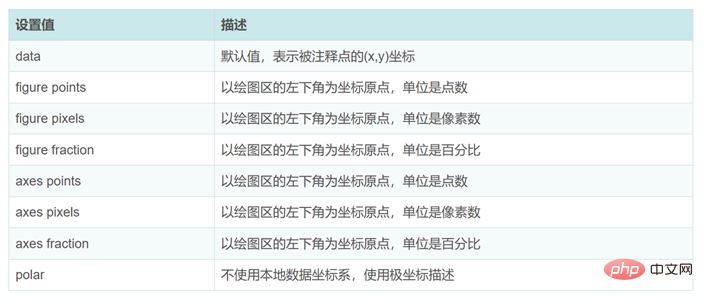
其中str即注释要使用的字符串,即注释文本;xy指被注释的坐标点;xytext指注释文本要写在的位置;xycoords是被注释的点的坐标系属性,即以什么样的方式描述该点的坐标。设置值默为"data",即用(x,y)坐标来描述。其他可以选择的设置值如下,其中figure指的是整个画布作为一个参考系。而axes则表示仅对于其中的一个axes对象区域。
arrowprops
 Der andere Abschnitt besteht darin, den Schlusskurs des Tages in der Nähe jedes Scheitelpunkts der Polylinie zu markieren.
import matplotlib.pyplot as plt
plt.rcParams['font.sans-serif'] = ['SimHei']
plt.rcParams['axes.unicode_minus'] = False
x = range(9)
y = [5.12, 5.15, 5.13, 5.10, 5.2, 5.25, 5.19, 5.24, 5.31]
c = 0.5 * (min(x) + max(x))
d = min(y) + 0.3 * (max(y) - min(y))
# 仿水印效果
plt.text(c, d, '旅途中的宽', ha = 'center', fontsize = 30, rotation = -25, c = 'gray', alpha = 0.4)
plt.plot(x, y, label = '股票A收盘价', c = 'r', ls = '-.', marker = 'D', lw = 2)
# plt.plot([5.09, 5.13, 5.16, 5.12, 5.09, 5.25, 5.16, 5.20, 5.25], label='股票B收盘价', c='g', ls=':', marker='H', lw=4)
plt.xticks(x, [
    '2022-03-27', '2022-03-28', '2022-03-29', '2022-03-30',
    '2022-03-31', '2022-04-01', '2022-04-04', '2022-04-05',
    '2022-04-06'], rotation = 45)
plt.title('某股票收盘价时序图')
plt.xlabel('日期')
plt.ylabel('价格')
plt.grid(True)
plt.legend()
# 标出每天的收盘价
for a, b in zip(x, y):
    plt.text(a, b + 0.01, '%.3f'% b, ha = 'center', va = 'bottom', fontsize = 9)
# 添加注释
plt.annotate('最低价', (x[y.index(min(y))], min(y)), (x[y.index(min(y))] + 0.5, min(y)), xycoords = 'data',
             arrowprops = dict(facecolor = 'r', shrink = 0.1), c = 'r',fontsize = 15)
plt.show()
2. Anmerkung hinzufügen plt.annotate()
Fügen Sie basierend auf dem obigen Beispielcode eine Anmerkung hinzu. Eine Anmerkung ist eine Erläuterung einer bestimmten Stelle im Bild, die mit einem Pfeil markiert werden kann.
Fügen Sie Anmerkungen mit der Methode plt.annotate() hinzu.
Die allgemeinen Parameter in der Syntax lauten wie folgt 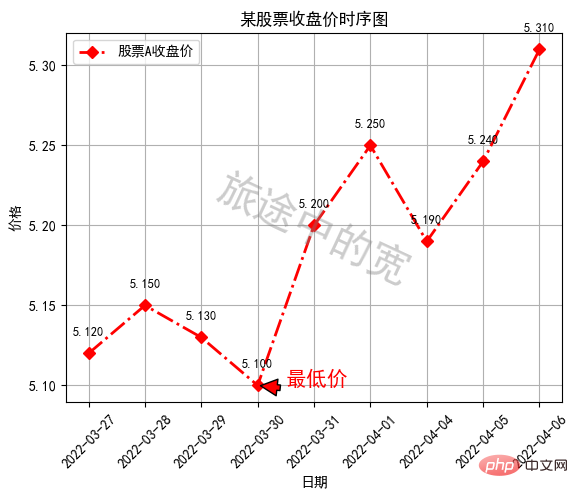
import matplotlib.pyplot as plt
plt.rcParams['font.sans-serif'] = ['SimHei']
plt.rcParams['axes.unicode_minus'] = False
x = range(9)
y = [5.12, 5.15, 5.13, 5.10, 5.2, 5.25, 5.19, 5.24, 5.31]
c = 0.5 * (min(x) + max(x))
d = min(y) + 0.3 * (max(y)-min(y))
plt.plot(x, y, label = '股票A收盘价', c = 'k', ls = '-.', marker = 'D', lw = 2)
plt.xticks(x, [
    '2022-03-27', '2022-03-28', '2022-03-29', '2022-03-30',
    '2022-03-31', '2022-04-01', '2022-04-04', '2022-04-05',
    '2022-04-06'], rotation = 45)
plt.title('某股票收盘价时序图')
plt.xlabel('日期')
plt.ylabel('价格')
plt.grid(True)
plt.legend()
# 标出每天的收盘价
for a, b in zip(x, y):
    plt.text(a, b+0.01, '%.1f'%b, ha='center', va='bottom', fontsize=9)
plt.text(c, d, '旅途中的宽', ha = 'center', fontsize = 50, rotation = -25, c = 'r')
plt.annotate('最低价', (x[y.index(min(y))], min(y)), (x[y.index(min(y))] + 2, min(y)), xycoords = 'data',
             arrowprops = dict(width = 3, headwidth = 10, headlength = 20, facecolor = 'g', shrink = 0.05), c = 'r',fontsize = 20)
plt.show()
#🎜🎜 # Unter diesen bezieht sich str auf die Zeichenfolge, die in der Anmerkung verwendet werden soll, d. h. der Anmerkungstext bezieht sich auf den Koordinatenpunkt, der mit xytext versehen wird bezieht sich auf den Anmerkungstext, in den die Position geschrieben werden soll; xycoords ist das Koordinatensystemattribut des annotierten Punkts, das heißt, wie die Koordinaten des Punkts beschrieben werden. Der Einstellungswert ist standardmäßig „Daten“, der durch (x, y)-Koordinaten beschrieben wird. Weitere optionale Einstellungswerte sind wie folgt, wobei sich Abbildung auf die gesamte Leinwand als Referenzsystem bezieht. Und Achsen bedeutet nur für einen der Achsenobjektbereiche.

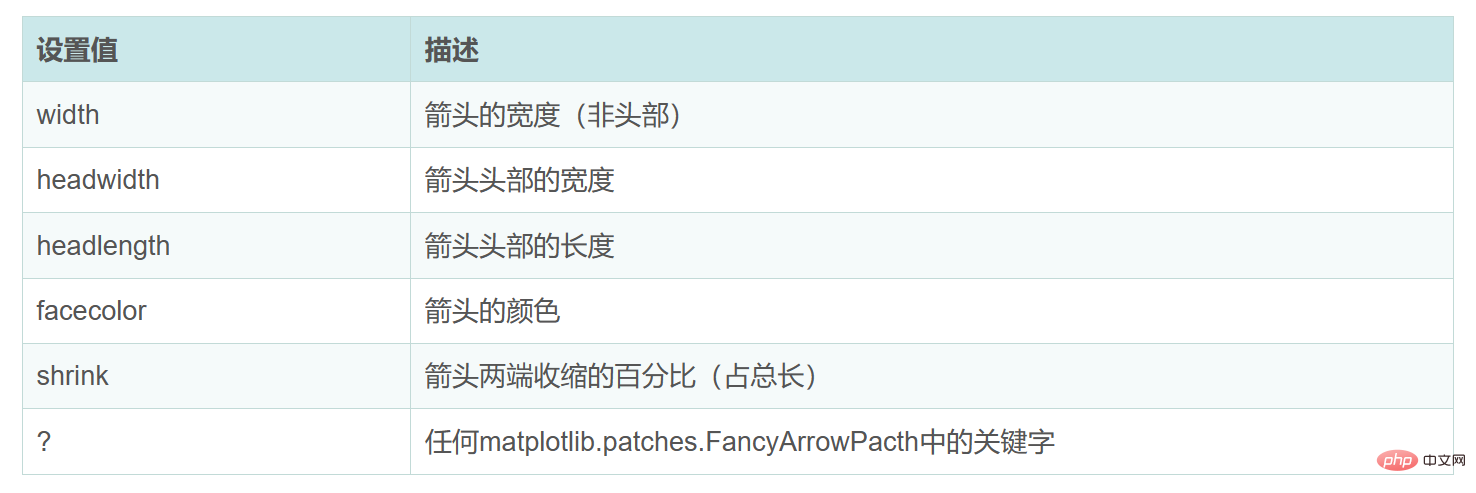
arrowprops ist ein Wörterbuch, das zum Festlegen der Eigenschaften von Pfeilen verwendet wird. Außerhalb dieses Wörterbuchs geschriebene Parameter stellen Attribute des Anmerkungstextes dar. 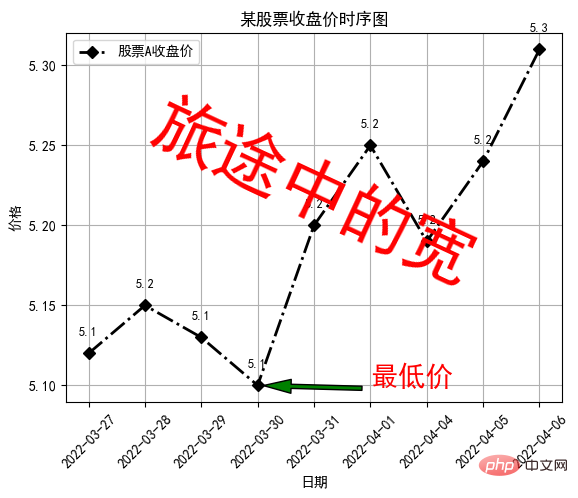
Das obige ist der detaillierte Inhalt vonSo fügen Sie Beschriftungen zu Matplotlib-Bildern in Python hinzu. Für weitere Informationen folgen Sie bitte anderen verwandten Artikeln auf der PHP chinesischen Website!

