Heim >Backend-Entwicklung >Python-Tutorial >So zeichnen Sie interessante Visualisierungsdiagramme mit Python
So zeichnen Sie interessante Visualisierungsdiagramme mit Python
- PHPznach vorne
- 2023-04-18 16:25:051685Durchsuche
SchemDraw
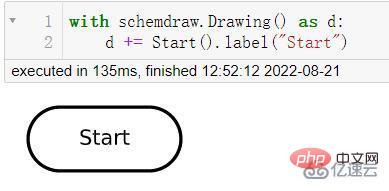
Im SchemDraw-Modul werden also sechs Elemente verwendet, um die Hauptknoten des Flussdiagramms darzustellen. Die Ovale stellen den Anfang und das Ende der Entscheidung dar. Der Code lautet wie folgt:
import schemdraw
from schemdraw.flow import *
with schemdraw.Drawing() as d:
 d += Start().label("Start")
output
with schemdraw.Drawing() as d:
 d += Arrow(w = 5).right().label("Connector")
Ausgabe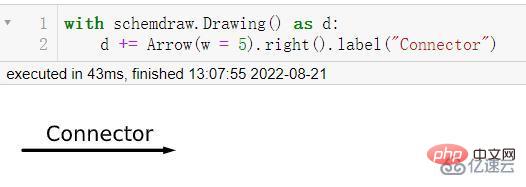
with schemdraw.Drawing() as d:
 d += Data(w = 5).label("What's the problem")
output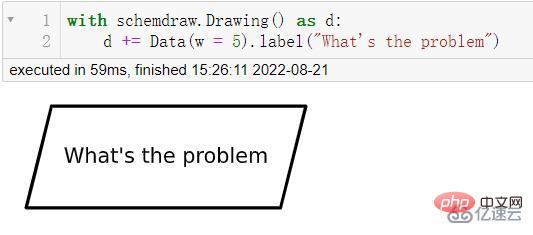
with schemdraw.Drawing() as d:
 d += Process(w = 5).label("Processing")
output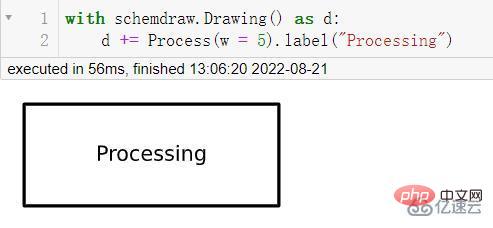
with schemdraw.Drawing() as d:
 d += Decision(w = 5).label("Decisions")
output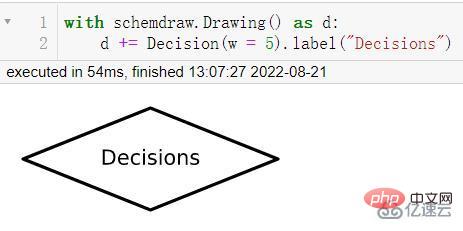
import schemdraw
from schemdraw.flow import *
with schemdraw.Drawing() as d:
 d+= Start().label("Start")
 d+= Arrow().down(d.unit/2)
 # 具体是啥问题嘞
 d+= Data(w = 4).label("Go camping or not")
 d+= Arrow().down(d.unit/2)
 # 第一步 查看天气
 d+= Box(w = 4).label("Check weather first")
 d+= Arrow().down(d.unit/2)
 # 是否是晴天
 d+= (decision := Decision(w = 5, h= 5,
S = "True",
 E = "False").label("See if it's sunny"))
 # 如果是真的话
 d+= Arrow().length(d.unit/2)
 d+= (true := Box(w = 5).label("Sunny, go camping"))
 d+= Arrow().length(d.unit/2)
 # 结束
 d+= (end := Ellipse().label("End"))
 # 如果不是晴天的话
 d+= Arrow().right(d.unit).at(decision.E)
 # 那如果是下雨天的话,就不能去露营咯
 d+= (false := Box(w = 5).label("Rainy, stay at home"))
 # 决策的走向
 d+= Arrow().down(d.unit*2.5).at(false.S)
 # 决策的走向
 d+= Arrow().left(d.unit*2.15)
d.save("palindrome flowchart.jpeg", dpi = 300)outputimport networkx as nx
import matplotlib.pyplot as plt
import numpy as np
G = nx.DiGraph()
nodes = np.arange(0, 8).tolist()
G.add_nodes_from(nodes)
# 节点连接的信息,哪些节点的是相连接的
G.add_edges_from([(0,1), (0,2),
(1,3), (1, 4),
(2, 5), (2, 6), (2,7)])
# 节点的位置
pos = {0:(10, 10),
1:(7.5, 7.5), 2:(12.5, 7.5),
3:(6, 6), 4:(9, 6),
5:(11, 6), 6:(14, 6), 7:(17, 6)}
# 节点的标记
labels = {0:"CEO",
1: "Team A Lead",
2: "Team B Lead",
3: "Staff A",
4: "Staff B",
5: "Staff C",
6: "Staff D",
7: "Staff E"}
nx.draw_networkx(G, pos = pos, labels = labels, arrows = True,
node_shape = "s", node_color = "white")
plt.title("Company Structure")
plt.show()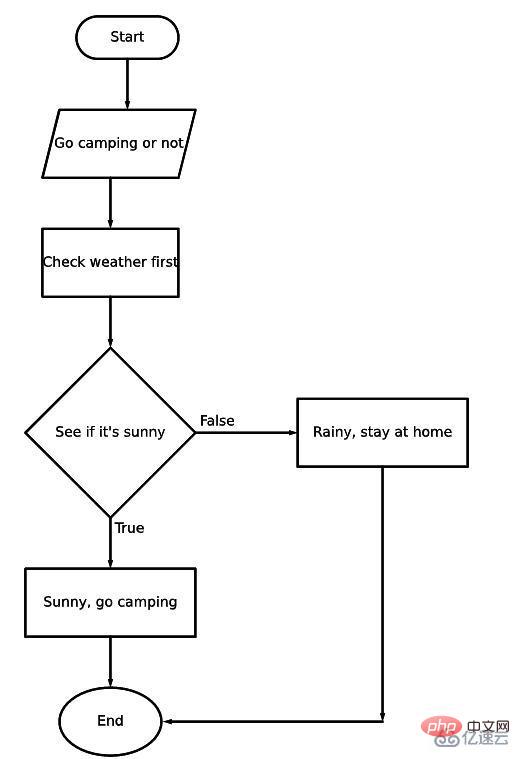 output
Wenn Sie dies sehen, werden Sie möglicherweise das Gefühl haben, dass die Ergebnisse erzielt werden Hervorheben ist etwas einfacher. Wenn Sie etwas Farbe hinzufügen möchten, lautet der Code wie folgt:
nx.draw_networkx(G, pos = pos, labels = labels,
bbox = dict(facecolor = "skyblue",
boxstyle = "round", ec = "silver", pad = 0.3),
edge_color = "gray"
 )
plt.title("Company Structure")
plt.show()
Ausgabe
Das obige ist der detaillierte Inhalt vonSo zeichnen Sie interessante Visualisierungsdiagramme mit Python. Für weitere Informationen folgen Sie bitte anderen verwandten Artikeln auf der PHP chinesischen Website!
Stellungnahme:
Dieser Artikel ist reproduziert unter:yisu.com. Bei Verstößen wenden Sie sich bitte an admin@php.cn löschen
Vorheriger Artikel:Ein super praktisches Python-Artefakt für die Verwendung von SQL!Nächster Artikel:Ein super praktisches Python-Artefakt für die Verwendung von SQL!

