Heim >Web-Frontend >js-Tutorial >Implementierung des Effekts der Baidu-Karten-ABCD-Markierung basierend auf Arcgis für javascript_javascript-Kenntnisse
Implementierung des Effekts der Baidu-Karten-ABCD-Markierung basierend auf Arcgis für javascript_javascript-Kenntnisse
- WBOYWBOYWBOYWBOYWBOYWBOYWBOYWBOYWBOYWBOYWBOYWBOYWBOriginal
- 2016-05-16 15:39:482295Durchsuche
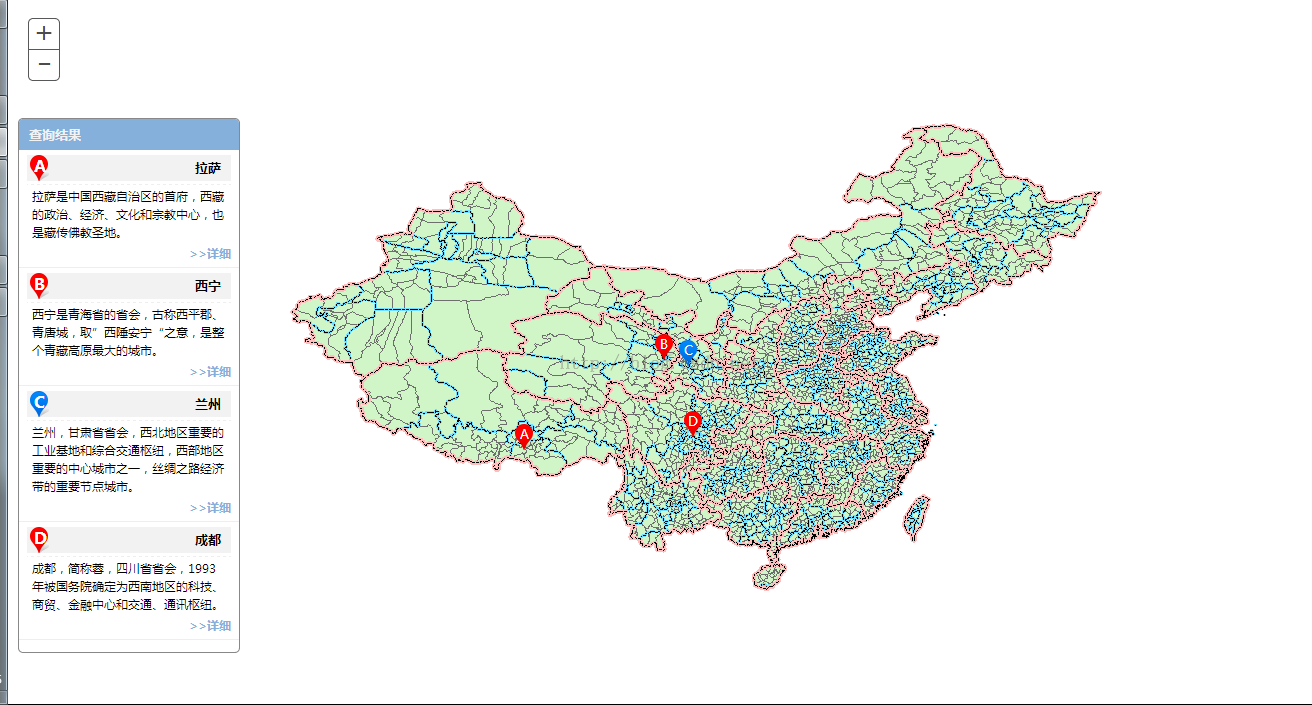
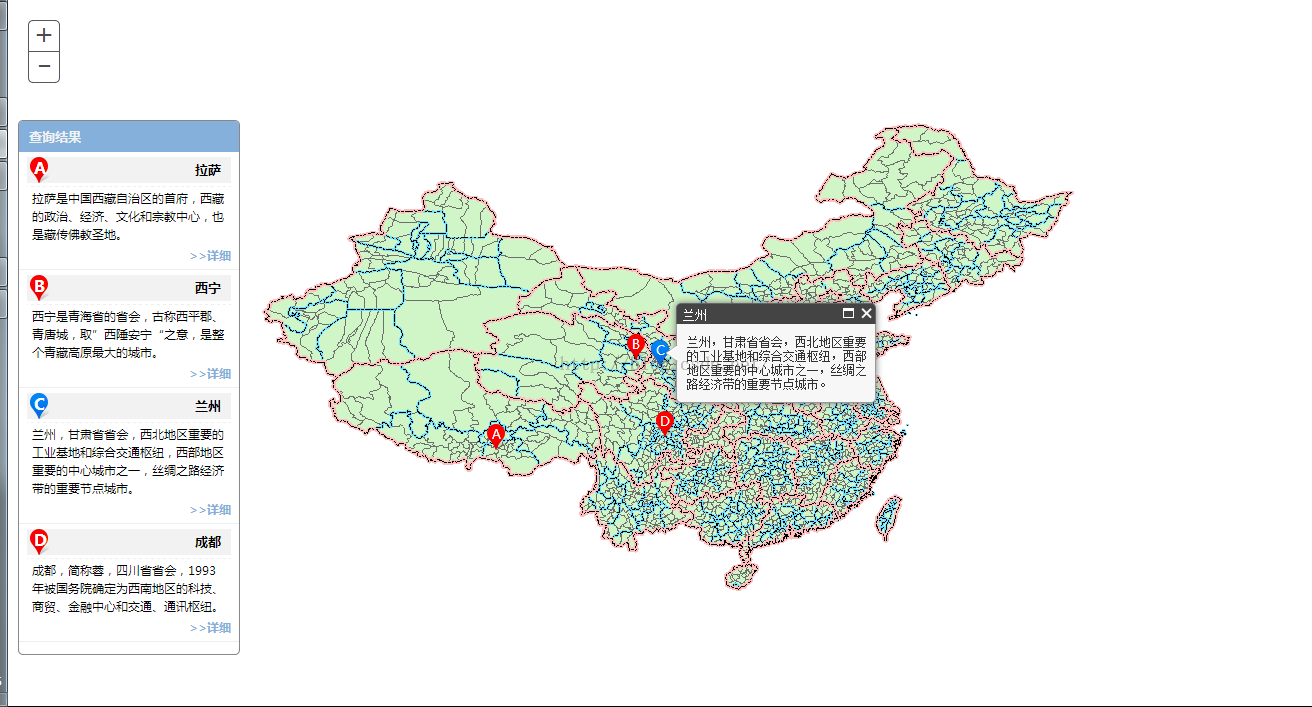
Lassen Sie mich Ihnen die Wirkung nach der Umsetzung zeigen:
Zur Veranschaulichung werde ich zuerst den Effekt posten, den ich gemacht habe

Listendarstellung, Kartendarstellung und Verknüpfung

Informationen anzeigen
Umsetzungsideen:
1. Interaktion zwischen Liste und Karte
Wenn die Maus über die Liste bewegt wird, wird das Listensymbol geändert und eine blaue Markierung wird auf der Karte basierend auf dem von der Liste zurückgegebenen Wert gezeichnet Die Kartenmarkierungsebene wird gelöscht.
Schlüsselcode:
title.on("mouseover",function(){
 var attr = $(this).data("attr");
 $("#icon"+attr.id).css("background","url('images/blue.png')");
 var pt=new Point(attr.x,attr.y,{"wkid":4326});
 var pms = new esri.symbol.PictureMarkerSymbol("images/blue.png",24,26)
 var gImg = new Graphic(pt,pms);
 gLyrHover.add(gImg);
});
title.on("mouseout",function(){
 var attr = $(this).data("attr");
 $("#icon"+attr.id).css("background","url('images/red.png')");
 gLyrHover.clear();
});
2. Interaktion zwischen Karte und Liste
Wenn die Maus über die rote Markierung auf der Karte bewegt wird, wird das entsprechende Listensymbol geändert und das rote Markierungsbild wird in blau geändert Rot.
Schlüsselcode:
gLyr.on("mouse-over",function(e){
 map.setMapCursor("pointer");
 var sms = e.graphic.symbol;
 sms.url = "images/blue.png";
 gLyr.redraw();
 $("#icon"+e.graphic.attributes.id).css("background","url('images/blue.png')");
});
gLyr.on("mouse-out",function(e){
 map.setMapCursor("default");
 var sms = e.graphic.symbol;
 sms.url = "images/red.png";
 gLyr.redraw();
 $("#icon"+e.graphic.attributes.id).css("background","url('images/red.png')");
});
3. Der ABCD-Text auf der Karte ist eine separate Ebene und nimmt nicht an der Interaktion teil.
4. Die Daten liegen im JSON-Format vor.
var data = [
 {
 "id":"A","name":"拉萨", "x":91.162998, "y":29.71042,
 "desc":"拉萨是中国西藏自治区的首府,西藏的政治、经济、文化和宗教中心,也是藏传佛教圣地。"
 },
 {
 "id":"B", "name":"西宁","x":101.797303,"y":36.593642,
 "desc":"西宁是青海省的省会,古称西平郡、青唐城,取”西陲安宁“之意,是整个青藏高原最大的城市。"
 },
 {
 "id":"C","name":"兰州","x":103.584297,"y":36.119086,
 "desc":"兰州,甘肃省省会,西北地区重要的工业基地和综合交通枢纽,西部地区重要的中心城市之一,丝绸之路经济带的重要节点城市。"
 },
 {
 "id":"D","name":"成都","x":104.035508,"y":30.714179,
 "desc":"成都,简称蓉,四川省省会,1993年被国务院确定为西南地区的科技、商贸、金融中心和交通、通讯枢纽。"
 }
];
Vollständiger Code:
<!DOCTYPE html>
<html>
<head>
 <meta http-equiv="Content-Type" content="text/html; charset=utf-8">
 <meta name="viewport" content="initial-scale=1, maximum-scale=1,user-scalable=no"/>
 <title></title>
 <link rel="stylesheet" href="http://localhost/arcgis_js_api/library/3.9/3.9/js/esri/css/esri.css">
 <style type="text/css">
 html, body, #map {
  height: 100%;
  margin: 0;
  padding: 0;
  font-size: 62.5%;
  font-family:"微软雅黑";
 }
 .search-box{
  z-index: 99;
  background: #fff;
  border: 1px solid #888888;
  border-radius: 5px;
  width: 220px;
  max-height:600px;
  overflow-y: auto;
  position: absolute;
  top: 120px;
  left: 10px;
 }
 .search-box-title{
  padding: 6px 10px;
  text-align: left;
  font-size: 13px;
  font-weight: bold;
  color: #f2f2f2;
  background: #85b0db;
 }
 .search-box-result{
  list-style: none;
  margin-left:-40px;
  margin-top: 0px;
 }
 .search-box-result-item{
  border-bottom: 1px solid #eeeeee;
  padding: 5px 8px;
 }
 .search-name{
  float: right;
  font-weight: bold;
  font-size: 13px;
  margin-top: 3px;
  margin-right: 10px;
 }
 .search-name-title{
  background: #f2f2f2;
 }
 .search-name-title:hover{
  cursor: pointer;
 }
 .search-detail{
  border-top: 1px dashed #eeeeee;
  margin-top: 3px;
  padding: 3px 5px;
  line-height: 18px;
 }
 .search-icon{
  background: url("images/red.png");
  width: 24px;
  height: 26px;
  background-repeat: no-repeat;
 }
 .search-text{
  color: #ffffff;
  font-weight: bold;
  font-size: 16px;
  margin-left:7px ;
 }
 .detail{
  color: #85b0db;
  font-weight: bold;
  text-align: right;
 }
 .detail:hover{
  cursor: pointer;
 }
 </style>
 <script src="http://localhost/arcgis_js_api/library/3.9/3.9/init.js"></script>
 <script src="jquery-1.8.3.js"></script>
 <script type="text/javascript">
 var map;
 var data = [
  {
  "id":"A","name":"拉萨", "x":91.162998, "y":29.71042,
  "desc":"拉萨是中国西藏自治区的首府,西藏的政治、经济、文化和宗教中心,也是藏传佛教圣地。"
  },
  {
  "id":"B", "name":"西宁","x":101.797303,"y":36.593642,
  "desc":"西宁是青海省的省会,古称西平郡、青唐城,取”西陲安宁“之意,是整个青藏高原最大的城市。"
  },
  {
  "id":"C","name":"兰州","x":103.584297,"y":36.119086,
  "desc":"兰州,甘肃省省会,西北地区重要的工业基地和综合交通枢纽,西部地区重要的中心城市之一,丝绸之路经济带的重要节点城市。"
  },
  {
  "id":"D","name":"成都","x":104.035508,"y":30.714179,
  "desc":"成都,简称蓉,四川省省会,1993年被国务院确定为西南地区的科技、商贸、金融中心和交通、通讯枢纽。"
  }
 ];
 require([
   "esri/map",
   "esri/layers/ArcGISTiledMapServiceLayer",
   "esri/geometry/Point",
   "esri/layers/GraphicsLayer",
   "esri/graphic",
   "dojo/_base/Color",
   "dojo/domReady!"],
  function(Map,
    Tiled,
    Point,
    GraphicsLayer,
    Graphic,
    Color)
  {
   map = new Map("map",{logo:false});
   var tiled = new Tiled("http://localhost:6080/arcgis/rest/services/china/MapServer",{"id":"tiled"});
   map.addLayer(tiled);
   var mapCenter = new Point(103.847, 36.0473, {"wkid":4326});
   map.centerAndZoom(mapCenter,0);
   var gLyr = new GraphicsLayer({"id":"gLyr"});
   map.addLayer(gLyr);
   var gLyrHover = new GraphicsLayer({"id":"gLyrHover"});
   map.addLayer(gLyrHover);
   var gLyrLbl = new GraphicsLayer({"id":"gLyrLbl"});
   map.addLayer(gLyrLbl);
   map.on("load",function(){
   $("#search").show();
   for(var i=0;i<data.length;i++){
    var li = $("<li />").addClass("search-box-result-item").appendTo($("#result"));
    var name = $("<div />").addClass("search-name").html(data[i].name);
    var icon = $("<div />").addClass("search-icon")
     .attr("id","icon"+data[i].id)
     .append("<div class='search-text'>"+data[i].id+"</div>");
    var title = $("<div />").addClass("search-name-title")
     .append(name).append(icon).appendTo(li)
     .data("attr",data[i]);
    var desc = $("<div />").addClass("search-detail").html(data[i].desc).appendTo(li);
    var more = $("<div />").addClass("detail").appendTo(li).html(">>详细");
    title.on("mouseover",function(){
    var attr = $(this).data("attr");
    $("#icon"+attr.id).css("background","url('images/blue.png')");
    var pt=new Point(attr.x,attr.y,{"wkid":4326});
    var pms = new esri.symbol.PictureMarkerSymbol("images/blue.png",24,26)
    var gImg = new Graphic(pt,pms);
    gLyrHover.add(gImg);
    });
    title.on("mouseout",function(){
    var attr = $(this).data("attr");
    $("#icon"+attr.id).css("background","url('images/red.png')");
    gLyrHover.clear();
    });
    title.on("click",function(){
    var attr = $(this).data("attr");
    showCity(attr);
    });
    var pt=new Point(data[i].x,data[i].y,{"wkid":4326});
    var pms = new esri.symbol.PictureMarkerSymbol("images/red.png",24,26)
    var gImg = new Graphic(pt,pms,data[i]);
    gLyr.add(gImg);
    var font = new esri.symbol.Font();
    font.setSize("10pt");
    font.setFamily("微软雅黑");
    var text = new esri.symbol.TextSymbol(data[i].id);
    text.setOffset(0,-2);
    text.setFont(font);
    text.setColor(new dojo.Color([255,255,255,100]));
    var gLbl = new esri.Graphic(pt,text,data[i]);
    gLyrLbl.add(gLbl);
   }
   gLyr.on("mouse-over",function(e){
    map.setMapCursor("pointer");
    var sms = e.graphic.symbol;
    sms.url = "images/blue.png";
    gLyr.redraw();
    $("#icon"+e.graphic.attributes.id).css("background","url('images/blue.png')");
   });
   gLyr.on("mouse-out",function(e){
    map.setMapCursor("default");
    var sms = e.graphic.symbol;
    sms.url = "images/red.png";
    gLyr.redraw();
    $("#icon"+e.graphic.attributes.id).css("background","url('images/red.png')");
   });
   gLyr.on("click",function(e){
    var attr = e.graphic.attributes;
    showCity(attr);
   });
   });

   function showCity(attr){
   var pt=new Point(attr.x,attr.y,{"wkid":4326});
   map.infoWindow.setTitle(attr.name);
   map.infoWindow.setContent(attr.desc);
   map.infoWindow.resize(200,80);
   map.infoWindow.show(pt);
   map.centerAndZoom(pt,0);
   }
  });
 </script>
</head>
<body>
<div id="search" class="search-box" style="display: none;">
 <div class="search-box-title">查询结果</div>
 <ul class="search-box-result" id="result">
 </ul>
</div>
<div id="map">
</div>
</body>
</html>
Der obige Inhalt ist der Effekt der Baidu-Map-ABCD-Markierung basierend auf Arcgis für Javascript, die vom Herausgeber von Script House geteilt wurde. Ich hoffe, er gefällt Ihnen.
In Verbindung stehende Artikel
Mehr sehen- Eine eingehende Analyse der Bootstrap-Listengruppenkomponente
- Detaillierte Erläuterung des JavaScript-Funktions-Curryings
- Vollständiges Beispiel für die Generierung von JS-Passwörtern und die Erkennung der Stärke (mit Download des Demo-Quellcodes)
- Angularjs integriert WeChat UI (weui)
- Wie man mit JavaScript schnell zwischen traditionellem Chinesisch und vereinfachtem Chinesisch wechselt und wie Websites den Wechsel zwischen vereinfachtem und traditionellem Chinesisch unterstützen – Javascript-Kenntnisse

