Heim >Backend-Entwicklung >Python-Tutorial >So implementieren Sie eine nichtlineare Support-Vektor-Maschine in TensorFlow
So implementieren Sie eine nichtlineare Support-Vektor-Maschine in TensorFlow
- 不言Original
- 2018-04-28 10:18:302677Durchsuche
本篇文章主要介绍了TensorFlow实现非线性支持向量机的实现方法,现在分享给大家,也给大家做个参考。一起过来看看吧
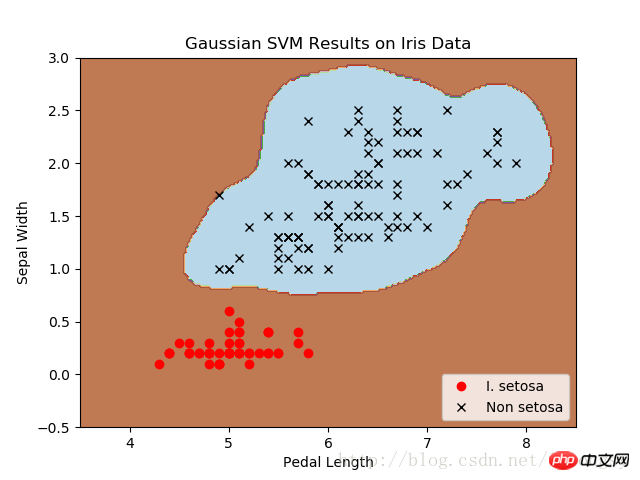
这里将加载iris数据集,创建一个山鸢尾花(I.setosa)的分类器。
# Nonlinear SVM Example
#----------------------------------
#
# This function wll illustrate how to
# implement the gaussian kernel on
# the iris dataset.
#
# Gaussian Kernel:
# K(x1, x2) = exp(-gamma * abs(x1 - x2)^2)

import matplotlib.pyplot as plt
import numpy as np
import tensorflow as tf
from sklearn import datasets
from tensorflow.python.framework import ops
ops.reset_default_graph()

# Create graph
sess = tf.Session()

# Load the data
# iris.data = [(Sepal Length, Sepal Width, Petal Length, Petal Width)]
# 加载iris数据集,抽取花萼长度和花瓣宽度,分割每类的x_vals值和y_vals值
iris = datasets.load_iris()
x_vals = np.array([[x[0], x[3]] for x in iris.data])
y_vals = np.array([1 if y==0 else -1 for y in iris.target])
class1_x = [x[0] for i,x in enumerate(x_vals) if y_vals[i]==1]
class1_y = [x[1] for i,x in enumerate(x_vals) if y_vals[i]==1]
class2_x = [x[0] for i,x in enumerate(x_vals) if y_vals[i]==-1]
class2_y = [x[1] for i,x in enumerate(x_vals) if y_vals[i]==-1]

# Declare batch size
# 声明批量大小(偏向于更大批量大小)
batch_size = 150

# Initialize placeholders
x_data = tf.placeholder(shape=[None, 2], dtype=tf.float32)
y_target = tf.placeholder(shape=[None, 1], dtype=tf.float32)
prediction_grid = tf.placeholder(shape=[None, 2], dtype=tf.float32)

# Create variables for svm
b = tf.Variable(tf.random_normal(shape=[1,batch_size]))

# Gaussian (RBF) kernel
# 声明批量大小(偏向于更大批量大小)
gamma = tf.constant(-25.0)
sq_dists = tf.multiply(2., tf.matmul(x_data, tf.transpose(x_data)))
my_kernel = tf.exp(tf.multiply(gamma, tf.abs(sq_dists)))

# Compute SVM Model
first_term = tf.reduce_sum(b)
b_vec_cross = tf.matmul(tf.transpose(b), b)
y_target_cross = tf.matmul(y_target, tf.transpose(y_target))
second_term = tf.reduce_sum(tf.multiply(my_kernel, tf.multiply(b_vec_cross, y_target_cross)))
loss = tf.negative(tf.subtract(first_term, second_term))

# Gaussian (RBF) prediction kernel
# 创建一个预测核函数
rA = tf.reshape(tf.reduce_sum(tf.square(x_data), 1),[-1,1])
rB = tf.reshape(tf.reduce_sum(tf.square(prediction_grid), 1),[-1,1])
pred_sq_dist = tf.add(tf.subtract(rA, tf.multiply(2., tf.matmul(x_data, tf.transpose(prediction_grid)))), tf.transpose(rB))
pred_kernel = tf.exp(tf.multiply(gamma, tf.abs(pred_sq_dist)))

# 声明一个准确度函数,其为正确分类的数据点的百分比
prediction_output = tf.matmul(tf.multiply(tf.transpose(y_target),b), pred_kernel)
prediction = tf.sign(prediction_output-tf.reduce_mean(prediction_output))
accuracy = tf.reduce_mean(tf.cast(tf.equal(tf.squeeze(prediction), tf.squeeze(y_target)), tf.float32))

# Declare optimizer
my_opt = tf.train.GradientDescentOptimizer(0.01)
train_step = my_opt.minimize(loss)

# Initialize variables
init = tf.global_variables_initializer()
sess.run(init)

# Training loop
loss_vec = []
batch_accuracy = []
for i in range(300):
  rand_index = np.random.choice(len(x_vals), size=batch_size)
  rand_x = x_vals[rand_index]
  rand_y = np.transpose([y_vals[rand_index]])
  sess.run(train_step, feed_dict={x_data: rand_x, y_target: rand_y})

  temp_loss = sess.run(loss, feed_dict={x_data: rand_x, y_target: rand_y})
  loss_vec.append(temp_loss)

  acc_temp = sess.run(accuracy, feed_dict={x_data: rand_x,
                       y_target: rand_y,
                       prediction_grid:rand_x})
  batch_accuracy.append(acc_temp)

  if (i+1)%75==0:
    print('Step #' + str(i+1))
    print('Loss = ' + str(temp_loss))

# Create a mesh to plot points in
# 为了绘制决策边界(Decision Boundary),我们创建一个数据点(x,y)的网格,评估预测函数
x_min, x_max = x_vals[:, 0].min() - 1, x_vals[:, 0].max() + 1
y_min, y_max = x_vals[:, 1].min() - 1, x_vals[:, 1].max() + 1
xx, yy = np.meshgrid(np.arange(x_min, x_max, 0.02),
           np.arange(y_min, y_max, 0.02))
grid_points = np.c_[xx.ravel(), yy.ravel()]
[grid_predictions] = sess.run(prediction, feed_dict={x_data: rand_x,
                          y_target: rand_y,
                          prediction_grid: grid_points})
grid_predictions = grid_predictions.reshape(xx.shape)

# Plot points and grid
plt.contourf(xx, yy, grid_predictions, cmap=plt.cm.Paired, alpha=0.8)
plt.plot(class1_x, class1_y, 'ro', label='I. setosa')
plt.plot(class2_x, class2_y, 'kx', label='Non setosa')
plt.title('Gaussian SVM Results on Iris Data')
plt.xlabel('Pedal Length')
plt.ylabel('Sepal Width')
plt.legend(loc='lower right')
plt.ylim([-0.5, 3.0])
plt.xlim([3.5, 8.5])
plt.show()

# Plot batch accuracy
plt.plot(batch_accuracy, 'k-', label='Accuracy')
plt.title('Batch Accuracy')
plt.xlabel('Generation')
plt.ylabel('Accuracy')
plt.legend(loc='lower right')
plt.show()

# Plot loss over time
plt.plot(loss_vec, 'k-')
plt.title('Loss per Generation')
plt.xlabel('Generation')
plt.ylabel('Loss')
plt.show()
输出:
Step #75
Loss = -110.332
Step #150
Loss = -222.832
Step #225
Loss = -335.332
Step #300
Loss = -447.832
四种不同的gamma值(1,10,25,100):


不同gamma值的山鸢尾花(I.setosa)的分类器结果图,采用高斯核函数的SVM。
gamma值越大,每个数据点对分类边界的影响就越大。
相关推荐:
Das obige ist der detaillierte Inhalt vonSo implementieren Sie eine nichtlineare Support-Vektor-Maschine in TensorFlow. Für weitere Informationen folgen Sie bitte anderen verwandten Artikeln auf der PHP chinesischen Website!
Stellungnahme:
Der Inhalt dieses Artikels wird freiwillig von Internetnutzern beigesteuert und das Urheberrecht liegt beim ursprünglichen Autor. Diese Website übernimmt keine entsprechende rechtliche Verantwortung. Wenn Sie Inhalte finden, bei denen der Verdacht eines Plagiats oder einer Rechtsverletzung besteht, wenden Sie sich bitte an admin@php.cn

