
Heim >Web-Frontend >js-Tutorial >JS-Front-End-Grafik-Plug-in-Tool Gojs-Komponente
JS-Front-End-Grafik-Plug-in-Tool Gojs-Komponente

- 小云云Original
- 2018-05-12 09:32:115816Durchsuche
Ich habe bereits zwei Artikel über die Front-End-Komponenten der Prozesszeichnung mit jsPlumb geteilt. Diese Komponente selbst ist nicht schlecht, einfach zu bedienen und leicht. Nach einiger Zeit habe ich jedoch festgestellt, dass die Komponente nicht stabil ist Auf der Seite ist der Verbindungsstil manchmal durcheinander. Sie müssen die Seite aktualisieren, bevor Sie sie wieder verwenden können. Außerdem ist der Verkabelungsstil relativ einfach, was zu einer starken visuellen Ermüdung führen kann Neben den gestiegenen Anforderungen an die Automatisierungssteuerung sind auch die Anforderungen an diese grafische Oberfläche gestiegen. Daher kann die Wirkung der einfachen jsPlumb-Komponente das Geschäft des wachsenden Unternehmens nicht mehr befriedigen. Basierend auf dem oben Gesagten habe ich schließlich die Gojs-Komponente gefunden, die über leistungsstarke Effekte und umfangreiche APIs verfügt. Der einzige Nachteil ist, dass es sich bei dieser Komponente um eine kostenpflichtige Komponente handelt.
1. Vorschau der Komponenteneffekte
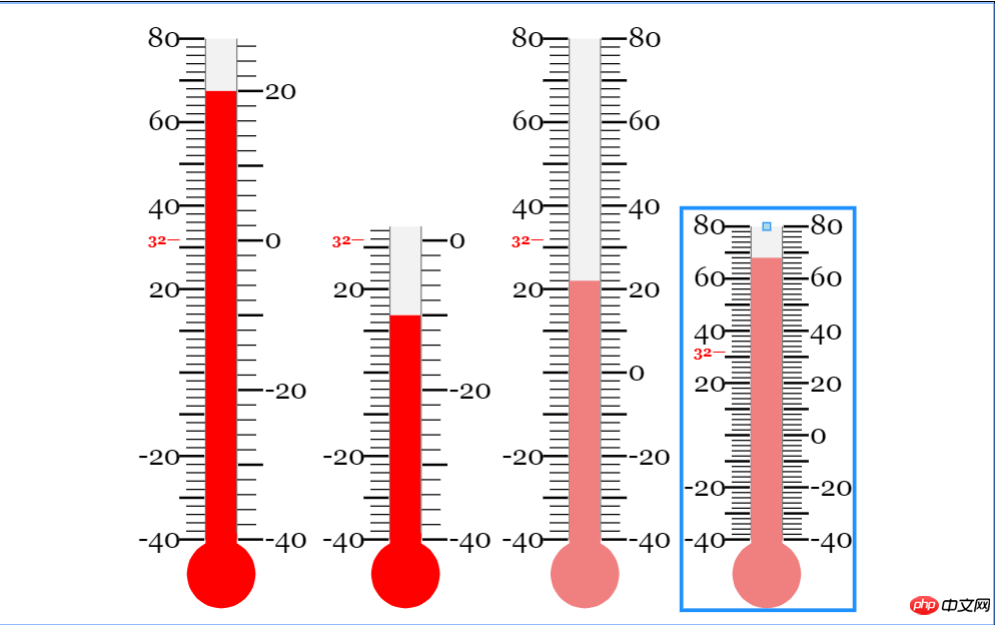
Beginnen wir mit zwei coolen Effekten
Die beiden unteren Effekte können von jsPlumb nicht erreicht werden, aber dieser Effekt ist in MES-Systemen, insbesondere in einigen prozessbezogenen Unternehmen, sehr attraktiv Dieser Effekt kann dazu führen, dass Sie sich auf den ersten Blick größer fühlen. Und auf den ersten Blick glaubt man nicht, dass dies der Effekt einer Webseite ist.
Weitere Wirkungsbeispiele
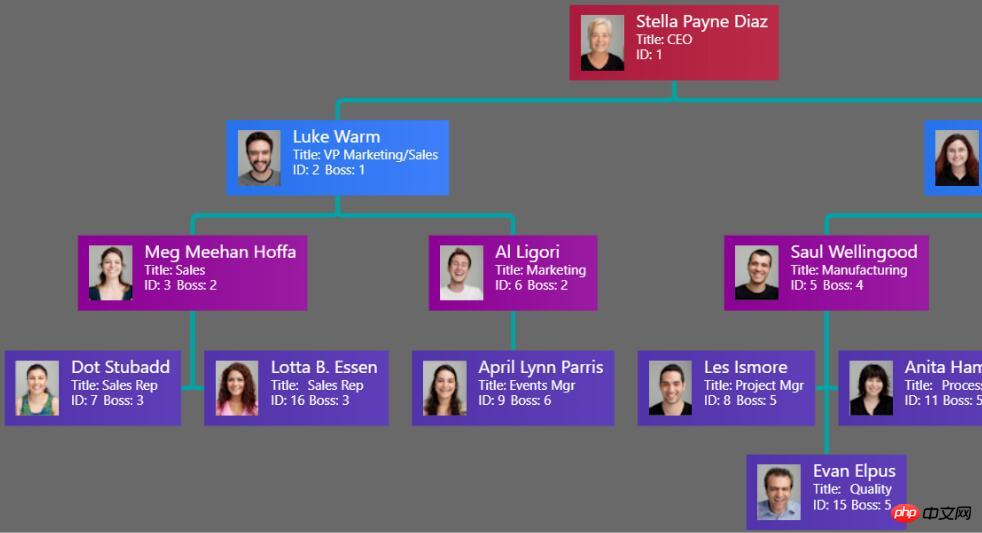
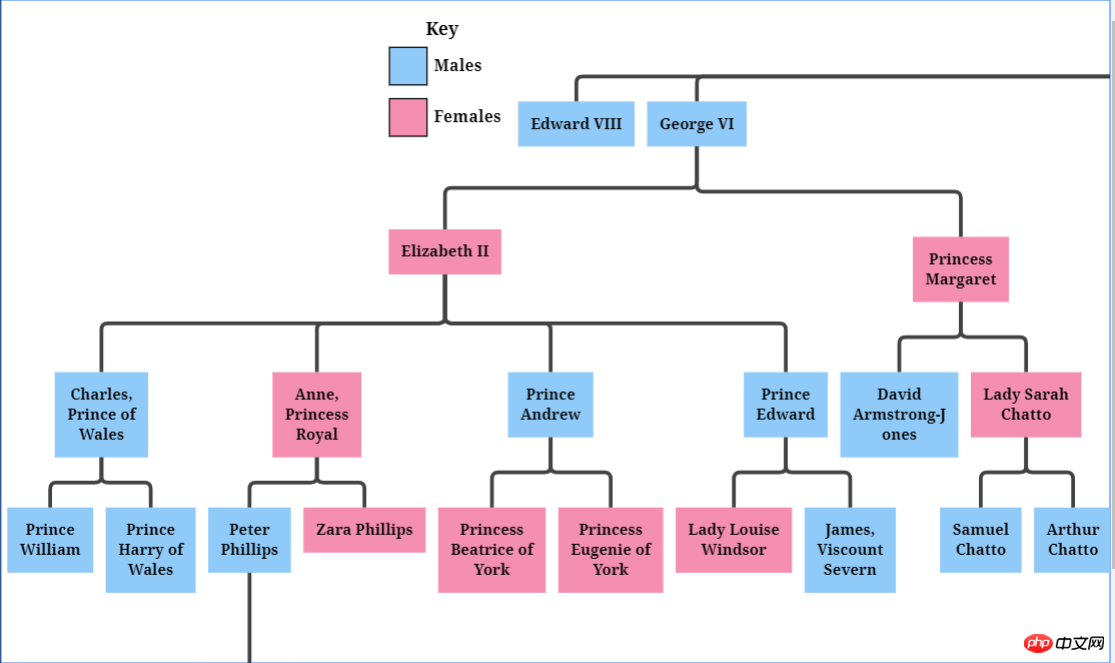
Zusammenklappbarer Baum
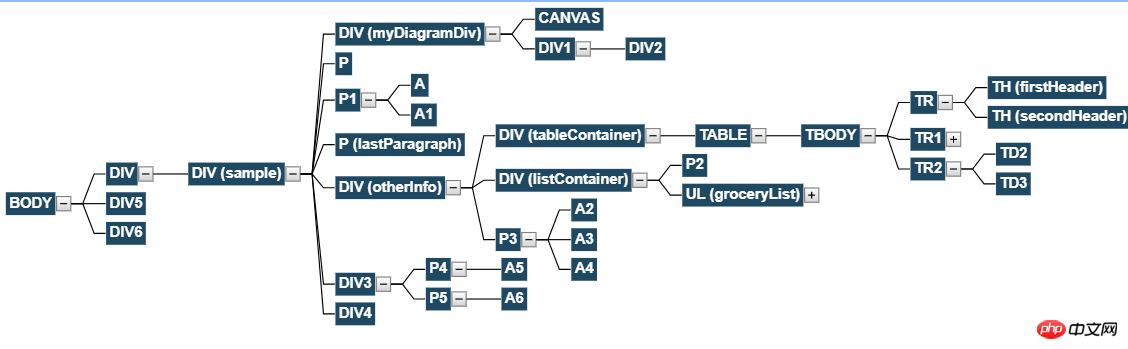
Ist das ein Bild?
Kann sogar Diagramme erstellen!
Möchten Sie Visios Job ergattern?
Weitere Beispiele finden Sie auf der offiziellen Website
2. Erster Kontakt
1. Einführung in Gojs
GoJS ist eine funktionsreiche JS-Bibliothek, die auf verwendet werden kann Webbrowser und Plattformen Realisieren Sie benutzerdefinierte Interaktionsdiagramme und komplexe Visualisierungseffekte. Es verwendet benutzerdefinierte Vorlagen und Layoutkomponenten, um komplexe JS-Diagramme wie Knoten, Links und Gruppen zu vereinfachen, und bietet viele erweiterte Funktionen für die Benutzerinteraktion, z. B. Drag & Drop und Kopieren , Einfügen, Ein erweitertes Werkzeugsystem für Textbearbeitung, Tooltips, Kontextmenüs, Autolayout, Vorlagen, Datenbindung und Modelle, Transaktionsstatus- und Rückgängig-Management, Paletten, Übersichten, Ereignishandler, Befehle und benutzerdefinierte Aktionen. GoJS ermöglicht Benutzerinteraktion und läuft vollständig im Browser und rendert HTML5-Canvas-Elemente oder SVG, ohne dass Server oder Plugins gewechselt werden müssen und ohne serverseitige Anfragen. GoJS ist nicht von einer JS-Bibliothek oder einem JS-Framework (wie Bootstrap, JQuery usw.) abhängig und kann mit jedem HTML- oder JS-Framework oder sogar ohne Framework arbeiten.
2. Erste Schritte
(1) Dateireferenz
Code kopieren Der Code ist wie folgt:
<script src="gojs/go-debug_ok.js"></script>
Sie können die neueste Version auf der CD verwenden oder auf die lokal heruntergeladene Datei verweisen. Wenn es sich um eine Entwicklung handelt, können Sie die Debug-Version von js zitieren und bei der offiziellen Ausführung die offizielle js zitieren. Dazu müssen Sie nichts sagen.
(2) Erstellen Sie eine Leinwand
Definieren Sie ein beliebiges HTML-Element als unsere Leinwand
Kopieren Sie den Code Der Code lautet wie folgt:
<p id="myDiagramp" style="margin:auto;width:300px; height:300px; background-color:#ddd;"></p>
Verwenden Sie dann die Gojs-API, um die Leinwand zu initialisieren.
//创建画布
  var objGo = go.GraphObject.make;
  var myDiagram = objGo(go.Diagram, "myDiagramp",
   {
    //模型图的中心位置所在坐标
    initialContentAlignment: go.Spot.Center,

    //允许用户操作图表的时候使用Ctrl-Z撤销和Ctrl-Y重做快捷键
    "undoManager.isEnabled": true,

    //不运行用户改变图表的规模
    allowZoom: false,

    //画布上面是否出现网格
    "grid.visible": true,

    //允许在画布上面双击的时候创建节点
    "clickCreatingTool.archetypeNodeData": { text: "Node" },

    //允许使用ctrl+c、ctrl+v复制粘贴
    "commandHandler.copiesTree": true,

    //允许使用delete键删除节点
    "commandHandler.deletesTree": true,

    // dragging for both move and copy
    "draggingTool.dragsTree": true,
   });
Das offizielle Beispiel verwendet das $-Symbol als Variable. Der Blogger ist der Meinung, dass das $-Symbol zu empfindlich ist, also ändern wir den Namen ~ Die oben genannten Parameter werden alle vom ausgewählten Blogger extrahiert. Weitere Parameter zum Initialisieren der Leinwand finden Sie im folgenden offiziellen API-Bild:
(3)创建模型数据(Model)
接着上面的代码,我们增加如下几行
var myModel = objGo(go.Model);//创建Model对象
  // model中的数据每一个js对象都代表着一个相应的模型图中的元素
  myModel.nodeDataArray = [
   { key: "工厂" },
   { key: "车间" },
   { key: "工人" },
   { key: "岗位" },
  ];
  myDiagram.model = myModel; //将模型数据绑定到画布图上
效果预览
(4)创建节点(Node)
上面有了画布和节点数据,只是有了一个雏形,但是还没有任何的图形化效果。我们加入一些效果试试
在gojs里面给我们提供了几种模型节点的可选项:
Shape:形状——Rectangle(矩形)、RoundedRectangle(圆角矩形),Ellipse(椭圆形),Triangle(三角形),Diamond(菱形),Circle(圆形)等
TextBlock:文本域(可编辑)
Picture:图片
Panel:容器来保存其他Node的集合
默认的节点模型代码只是由一个TextBlock组件构建成
我们增加如下一段代码
// 定义一个简单的节点模板
  myDiagram.nodeTemplate =
   objGo(go.Node, "Horizontal",//横向布局的面板
    // 节点淡蓝色背景
    { background: "#44CCFF" },
    objGo(go.Shape,
     "RoundedRectangle", //定义形状,这是圆角矩形
     { /* Shape的参数。宽高颜色等等*/figure: "Club", width: 40, height: 60, margin: 4, fill: 'red' },
     // 绑定 Shape.figure属性为Node.data.fig的值,Model对象可以通过Node.data.fig 获取和设置Shape.figure(修改形状)
     new go.Binding("figure", "fig"), new go.Binding('fill', 'fill2')),
    objGo(go.TextBlock,
     "Default Text", // 默认文本
     // 设置字体大小颜色以及边距
     { margin: 12, stroke: "white", font: "bold 16px sans-serif" },
     //绑定TextBlock.text 属性为Node.data.name的值,Model对象可以通过Node.data.name获取和设置TextBlock.text
     new go.Binding("text", "name"))
   );

  var myModel = objGo(go.Model);//创建Model对象
  // model中的数据每一个js对象都代表着一个相应的模型图中的元素
  myModel.nodeDataArray = [
   { name: "工厂", fig: 'YinYang', fill2: 'blue' },
   { name: "车间", fig: 'Peace', fill2: 'red' },
   { name: "工人", fig: 'NotAllowed', fill2: 'green' },
   { name: "岗位", fig: 'Fragile', fill2: 'yellow' },
  ];
  myDiagram.model = myModel; //将模型数据绑定到画布图上
代码释疑:以上我们给画布对象定义了两种节点模板,一种是文本节点,另一种是形状节点(Node)。在形状节点中,我们定义了数据模型的通用节点样式,就是这一段代码{ /* Shape的参数。宽高颜色等等*/figure: "Club", width: 40, height: 60, margin: 4, fill: 'red' },然后通过new go.Binding("figure", "fig")方法将模板里面的属性映射到数据实例中,比如这里模板里面的figure属性定义的是Club,如果在我们的数据里面定义fig属性,那么它就会覆盖模板里面的figure的默认值。同样,fill和fill2也是通过同样的原理去区别模板中的样式和实例中的实际样式的!
注:更多figure属性的取值详见这里
效果如下
由此可见我们数据里面的属性会覆盖模板的原始属性,如果是新增的节点,由于没有自定义数据属性,所以呈现到界面上面的时候就是模板里面的原生样式!
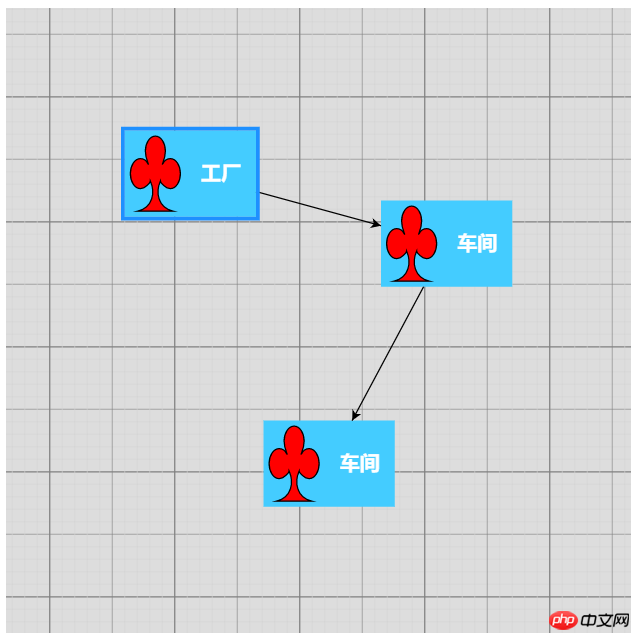
(5)节点连线
有了上面的基础,我们可以在画布上面画出我们想要的图形效果了,可是还没有连线。我们知道连线是建立在节点模型的上面的,于是乎我们的Model又分为了以下三种类型:
Model:最基本的(不带连线,如上面的例子)
GraphLinksModel :高级点的动态连线图
TreeModel:树形图的模型(从例子看好像用的不多)
GraphLinksModel中为model.nodeDataArray提供model.linkDataArray为node节点连线保存数据模型信息,其实也是的一个JSON数组对象,每个线条都有两个属性 “to” 和 “from” 即Node节点的“key”值,两个属性代表两个key表示两个节点间的连线。
我们上面已经写过最基本的Model的例子了,我们再来个带连线的Model的示例
var myModel = objGo(go.GraphLinksModel);
  myModel.nodeDataArray =
   [
    { key: "aaa" ,name: "工厂" },
    { key: "bbb" ,name: "车间"},
    { key: "ccc" ,name: "车间" }
   ];
  myModel.linkDataArray =
   [
    { from: "aaa", to: "bbb" },
    { from: "bbb", to: "ccc" }
   ];
  myDiagram.model = myModel;
效果如下
学习了Model、GraphLinksModel,还剩下一种TreeModel树节点的模型,这个博主不打算做详细介绍,有兴趣可以直接查看官网。
三、综合效果
关于综合效果,博主不打算将gojs的api逐个翻个遍了,这样太耗时间,伤不起,只是将官方示例中的部分源码截取出来供大家参考。有需要的再细究!
1、自定义流程的使用
<!DOCTYPE html>
<html>
<head>
<meta name="viewport" content="width=device-width, initial-scale=1">
<title>Draggable Link</title>
<meta name="description" content="Drag a link to reconnect it. Nodes have custom Adornments for selection, resizing, and reshaping." />
<!-- Copyright 1998-2017 by Northwoods Software Corporation. -->
<meta charset="UTF-8">
<script src="../../gojs/go-debug.js"></script>
<script id="code">
function init() {
if (window.goSamples) goSamples(); // init for these samples -- you don't need to call this
var objGo = go.GraphObject.make; // for conciseness in defining templates
myDiagram =
objGo(go.Diagram, "myDiagramp", // must name or refer to the p HTML element
{
grid: objGo(go.Panel, "Grid",
objGo(go.Shape, "LineH", { stroke: "lightgray", strokeWidth: 0.5 }),
objGo(go.Shape, "LineH", { stroke: "gray", strokeWidth: 0.5, interval: 10 }),
objGo(go.Shape, "LineV", { stroke: "lightgray", strokeWidth: 0.5 }),
objGo(go.Shape, "LineV", { stroke: "gray", strokeWidth: 0.5, interval: 10 })
),
allowDrop: true, // must be true to accept drops from the Palette
"draggingTool.dragsLink": true,
"draggingTool.isGridSnapEnabled": true,
"linkingTool.isUnconnectedLinkValid": true,
"linkingTool.portGravity": 20,
"relinkingTool.isUnconnectedLinkValid": true,
"relinkingTool.portGravity": 20,
"relinkingTool.fromHandleArchetype":
objGo(go.Shape, "Diamond", { segmentIndex: 0, cursor: "pointer", desiredSize: new go.Size(8, 8), fill: "tomato", stroke: "darkred" }),
"relinkingTool.toHandleArchetype":
objGo(go.Shape, "Diamond", { segmentIndex: -1, cursor: "pointer", desiredSize: new go.Size(8, 8), fill: "darkred", stroke: "tomato" }),
"linkReshapingTool.handleArchetype":
objGo(go.Shape, "Diamond", { desiredSize: new go.Size(7, 7), fill: "lightblue", stroke: "deepskyblue" }),
rotatingTool: objGo(TopRotatingTool), // defined below
"rotatingTool.snapAngleMultiple": 15,
"rotatingTool.snapAngleEpsilon": 15,
"undoManager.isEnabled": true
});
// when the document is modified, add a "*" to the title and enable the "Save" button
myDiagram.addDiagramListener("Modified", function(e) {
var button = document.getElementById("SaveButton");
if (button) button.disabled = !myDiagram.isModified;
var idx = document.title.indexOf("*");
if (myDiagram.isModified) {
if (idx < 0) document.title += "*";
} else {
if (idx >= 0) document.title = document.title.substr(0, idx);
}
});
// Define a function for creating a "port" that is normally transparent.
// The "name" is used as the GraphObject.portId, the "spot" is used to control how links connect
// and where the port is positioned on the node, and the boolean "output" and "input" arguments
// control whether the user can draw links from or to the port.
function makePort(name, spot, output, input) {
// the port is basically just a small transparent square
return objGo(go.Shape, "Circle",
{
fill: null, // not seen, by default; set to a translucent gray by showSmallPorts, defined below
stroke: null,
desiredSize: new go.Size(7, 7),
alignment: spot, // align the port on the main Shape
alignmentFocus: spot, // just inside the Shape
portId: name, // declare this object to be a "port"
fromSpot: spot, toSpot: spot, // declare where links may connect at this port
fromLinkable: output, toLinkable: input, // declare whether the user may draw links to/from here
cursor: "pointer" // show a different cursor to indicate potential link point
});
}
var nodeSelectionAdornmentTemplate =
objGo(go.Adornment, "Auto",
objGo(go.Shape, { fill: null, stroke: "deepskyblue", strokeWidth: 1.5, strokeDashArray: [4, 2] }),
objGo(go.Placeholder)
);
var nodeResizeAdornmentTemplate =
objGo(go.Adornment, "Spot",
{ locationSpot: go.Spot.Right },
objGo(go.Placeholder),
objGo(go.Shape, { alignment: go.Spot.TopLeft, cursor: "nw-resize", desiredSize: new go.Size(6, 6), fill: "lightblue", stroke: "deepskyblue" }),
objGo(go.Shape, { alignment: go.Spot.Top, cursor: "n-resize", desiredSize: new go.Size(6, 6), fill: "lightblue", stroke: "deepskyblue" }),
objGo(go.Shape, { alignment: go.Spot.TopRight, cursor: "ne-resize", desiredSize: new go.Size(6, 6), fill: "lightblue", stroke: "deepskyblue" }),
objGo(go.Shape, { alignment: go.Spot.Left, cursor: "w-resize", desiredSize: new go.Size(6, 6), fill: "lightblue", stroke: "deepskyblue" }),
objGo(go.Shape, { alignment: go.Spot.Right, cursor: "e-resize", desiredSize: new go.Size(6, 6), fill: "lightblue", stroke: "deepskyblue" }),
objGo(go.Shape, { alignment: go.Spot.BottomLeft, cursor: "se-resize", desiredSize: new go.Size(6, 6), fill: "lightblue", stroke: "deepskyblue" }),
objGo(go.Shape, { alignment: go.Spot.Bottom, cursor: "s-resize", desiredSize: new go.Size(6, 6), fill: "lightblue", stroke: "deepskyblue" }),
objGo(go.Shape, { alignment: go.Spot.BottomRight, cursor: "sw-resize", desiredSize: new go.Size(6, 6), fill: "lightblue", stroke: "deepskyblue" })
);
var nodeRotateAdornmentTemplate =
objGo(go.Adornment,
{ locationSpot: go.Spot.Center, locationObjectName: "CIRCLE" },
objGo(go.Shape, "Circle", { name: "CIRCLE", cursor: "pointer", desiredSize: new go.Size(7, 7), fill: "lightblue", stroke: "deepskyblue" }),
objGo(go.Shape, { geometryString: "M3.5 7 L3.5 30", isGeometryPositioned: true, stroke: "deepskyblue", strokeWidth: 1.5, strokeDashArray: [4, 2] })
);
myDiagram.nodeTemplate =
objGo(go.Node, "Spot",
{ locationSpot: go.Spot.Center },
new go.Binding("location", "loc", go.Point.parse).makeTwoWay(go.Point.stringify),
{ selectable: true, selectionAdornmentTemplate: nodeSelectionAdornmentTemplate },
{ resizable: true, resizeObjectName: "PANEL", resizeAdornmentTemplate: nodeResizeAdornmentTemplate },
{ rotatable: true, rotateAdornmentTemplate: nodeRotateAdornmentTemplate },
new go.Binding("angle").makeTwoWay(),
// the main object is a Panel that surrounds a TextBlock with a Shape
objGo(go.Panel, "Auto",
{ name: "PANEL" },
new go.Binding("desiredSize", "size", go.Size.parse).makeTwoWay(go.Size.stringify),
objGo(go.Shape, "Rectangle", // default figure
{
portId: "", // the default port: if no spot on link data, use closest side
fromLinkable: true, toLinkable: true, cursor: "pointer",
fill: "white", // default color
strokeWidth: 2
},
new go.Binding("figure"),
new go.Binding("fill")),
objGo(go.TextBlock,
{
font: "bold 11pt Helvetica, Arial, sans-serif",
margin: 8,
maxSize: new go.Size(160, NaN),
wrap: go.TextBlock.WrapFit,
editable: true
},
new go.Binding("text").makeTwoWay())
),
// four small named ports, one on each side:
makePort("T", go.Spot.Top, false, true),
makePort("L", go.Spot.Left, true, true),
makePort("R", go.Spot.Right, true, true),
makePort("B", go.Spot.Bottom, true, false),
{ // handle mouse enter/leave events to show/hide the ports
mouseEnter: function(e, node) { showSmallPorts(node, true); },
mouseLeave: function(e, node) { showSmallPorts(node, false); }
}
);
function showSmallPorts(node, show) {
node.ports.each(function(port) {
if (port.portId !== "") { // don't change the default port, which is the big shape
port.fill = show ? "rgba(0,0,0,.3)" : null;
}
});
}
var linkSelectionAdornmentTemplate =
objGo(go.Adornment, "Link",
objGo(go.Shape,
// isPanelMain declares that this Shape shares the Link.geometry
{ isPanelMain: true, fill: null, stroke: "deepskyblue", strokeWidth: 0 }) // use selection object's strokeWidth
);
myDiagram.linkTemplate =
objGo(go.Link, // the whole link panel
{ selectable: true, selectionAdornmentTemplate: linkSelectionAdornmentTemplate },
{ relinkableFrom: true, relinkableTo: true, reshapable: true },
{
routing: go.Link.AvoidsNodes,
curve: go.Link.JumpOver,
corner: 5,
toShortLength: 4
},
new go.Binding("points").makeTwoWay(),
objGo(go.Shape, // the link path shape
{ isPanelMain: true, strokeWidth: 2 }),
objGo(go.Shape, // the arrowhead
{ toArrow: "Standard", stroke: null }),
objGo(go.Panel, "Auto",
new go.Binding("visible", "isSelected").ofObject(),
objGo(go.Shape, "RoundedRectangle", // the link shape
{ fill: "#F8F8F8", stroke: null }),
objGo(go.TextBlock,
{
textAlign: "center",
font: "10pt helvetica, arial, sans-serif",
stroke: "#919191",
margin: 2,
minSize: new go.Size(10, NaN),
editable: true
},
new go.Binding("text").makeTwoWay())
)
);
load(); // load an initial diagram from some JSON text
// initialize the Palette that is on the left side of the page
myPalette =
objGo(go.Palette, "myPalettep", // must name or refer to the p HTML element
{
maxSelectionCount: 1,
nodeTemplateMap: myDiagram.nodeTemplateMap, // share the templates used by myDiagram
linkTemplate: // simplify the link template, just in this Palette
objGo(go.Link,
{ // because the GridLayout.alignment is Location and the nodes have locationSpot == Spot.Center,
// to line up the Link in the same manner we have to pretend the Link has the same location spot
locationSpot: go.Spot.Center,
selectionAdornmentTemplate:
objGo(go.Adornment, "Link",
{ locationSpot: go.Spot.Center },
objGo(go.Shape,
{ isPanelMain: true, fill: null, stroke: "deepskyblue", strokeWidth: 0 }),
objGo(go.Shape, // the arrowhead
{ toArrow: "Standard", stroke: null })
)
},
{
routing: go.Link.AvoidsNodes,
curve: go.Link.JumpOver,
corner: 5,
toShortLength: 4
},
new go.Binding("points"),
objGo(go.Shape, // the link path shape
{ isPanelMain: true, strokeWidth: 2 }),
objGo(go.Shape, // the arrowhead
{ toArrow: "Standard", stroke: null })
),
model: new go.GraphLinksModel([ // specify the contents of the Palette
{ text: "Start", figure: "Circle", fill: "#00AD5F" },
{ text: "Step" },
{ text: "DB", figure: "Database", fill: "lightgray" },
{ text: "???", figure: "Diamond", fill: "lightskyblue" },
{ text: "End", figure: "Circle", fill: "#CE0620" },
{ text: "Comment", figure: "RoundedRectangle", fill: "lightyellow" }
], [
// the Palette also has a disconnected Link, which the user can drag-and-drop
{ points: new go.List(go.Point).addAll([new go.Point(0, 0), new go.Point(30, 0), new go.Point(30, 40), new go.Point(60, 40)]) }
])
});
}
function TopRotatingTool() {
go.RotatingTool.call(this);
}
go.Diagram.inherit(TopRotatingTool, go.RotatingTool);
/** @override */
TopRotatingTool.prototype.updateAdornments = function(part) {
go.RotatingTool.prototype.updateAdornments.call(this, part);
var adornment = part.findAdornment("Rotating");
if (adornment !== null) {
adornment.location = part.rotateObject.getDocumentPoint(new go.Spot(0.5, 0, 0, -30)); // above middle top
}
};
/** @override */
TopRotatingTool.prototype.rotate = function(newangle) {
go.RotatingTool.prototype.rotate.call(this, newangle + 90);
};
// end of TopRotatingTool class
// Show the diagram's model in JSON format that the user may edit
function save() {
saveDiagramProperties(); // do this first, before writing to JSON
document.getElementById("mySavedModel").value = myDiagram.model.toJson();
myDiagram.isModified = false;
}
function load() {
myDiagram.model = go.Model.fromJson(document.getElementById("mySavedModel").value);
loadDiagramProperties(); // do this after the Model.modelData has been brought into memory
}
function saveDiagramProperties() {
myDiagram.model.modelData.position = go.Point.stringify(myDiagram.position);
}
function loadDiagramProperties(e) {
// set Diagram.initialPosition, not Diagram.position, to handle initialization side-effects
var pos = myDiagram.model.modelData.position;
if (pos) myDiagram.initialPosition = go.Point.parse(pos);
}
</script>
</head>
<body onload="init()">
<p id="sample">
<p style="width:100%; white-space:nowrap;">
<span style="display: inline-block; vertical-align: top; width:105px">
<p id="myPalettep" style="border: solid 1px black; height: 620px"></p>
</span>
<span style="display: inline-block; vertical-align: top; width:80%">
<p id="myDiagramp" style="border: solid 1px black; height: 620px"></p>
</span>
</p>
<p>
This sample demonstrates the ability for the user to drag around a Link as if it were a Node.
When either end of the link passes over a valid port, the port is highlighted.
</p>
<p>
The link-dragging functionality is enabled by setting some or all of the following properties:
<a>DraggingTool.dragsLink</a>, <a>LinkingTool.isUnconnectedLinkValid</a>, and
<a>RelinkingTool.isUnconnectedLinkValid</a>.
</p>
<p>
Note that a Link is present in the <a>Palette</a> so that it too can be dragged out and onto
the main Diagram. Because links are not automatically routed when either end is not connected
with a Node, the route is provided explicitly when that Palette item is defined.
</p>
<p>
This also demonstrates several custom Adornments:
<a>Part.selectionAdornmentTemplate</a>, <a>Part.resizeAdornmentTemplate</a>, and
<a>Part.rotateAdornmentTemplate</a>.
</p>
<p>
Finally this sample demonstrates saving and restoring the <a>Diagram.position</a> as a property
on the <a>Model.modelData</a> object that is automatically saved and restored when calling <a>Model.toJson</a>
and <a>Model.fromJson</a>.
</p>
<p>
<p>
<button id="SaveButton" onclick="save()">Save</button>
<button onclick="load()">Load</button>
Diagram Model saved in JSON format:
</p>
<textarea id="mySavedModel" style="width:100%;height:300px">
{ "class": "go.GraphLinksModel",
"linkFromPortIdProperty": "fromPort",
"linkToPortIdProperty": "toPort",
"nodeDataArray": [
],
"linkDataArray": [
]}
</textarea>
</p>
</p>
</body>
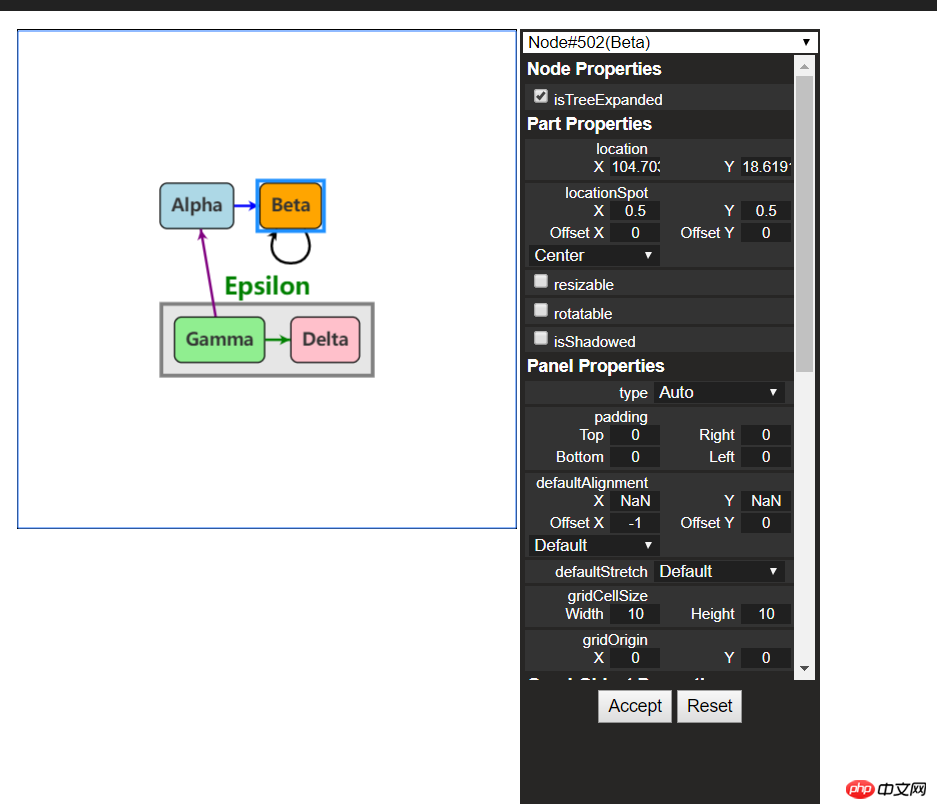
</html>效果如下:
建议各位copy代码,在本地看到效果,然后再根据实际需求去研究它的api,这样才不会太盲目而花费太多时间。
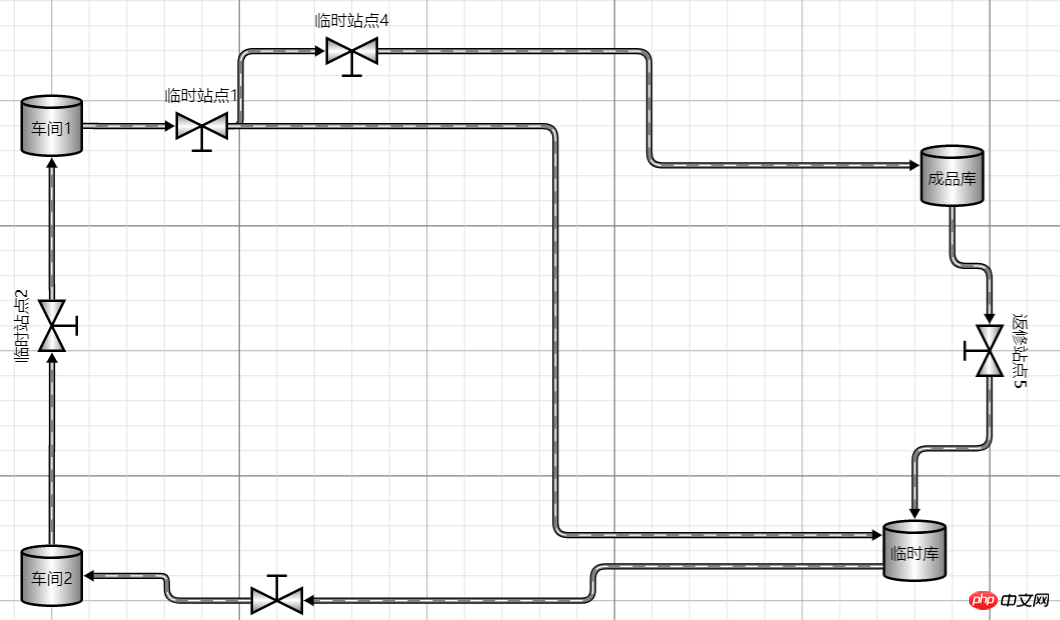
2、工业流程图
<!DOCTYPE html>
<html>
<head>
<meta name="viewport" content="width=device-width, initial-scale=1">
<title>Process Flow</title>
<meta name="description" content="A simple process flow or SCADA diagram editor, simulating equipment monitoring and control." />
<!-- Copyright 1998-2017 by Northwoods Software Corporation. -->
<meta charset="UTF-8">
<script src="../../gojs/go-debug.js"></script>
<script id="code">
function init() {
if (window.goSamples) goSamples(); // init for these samples -- you don't need to call this
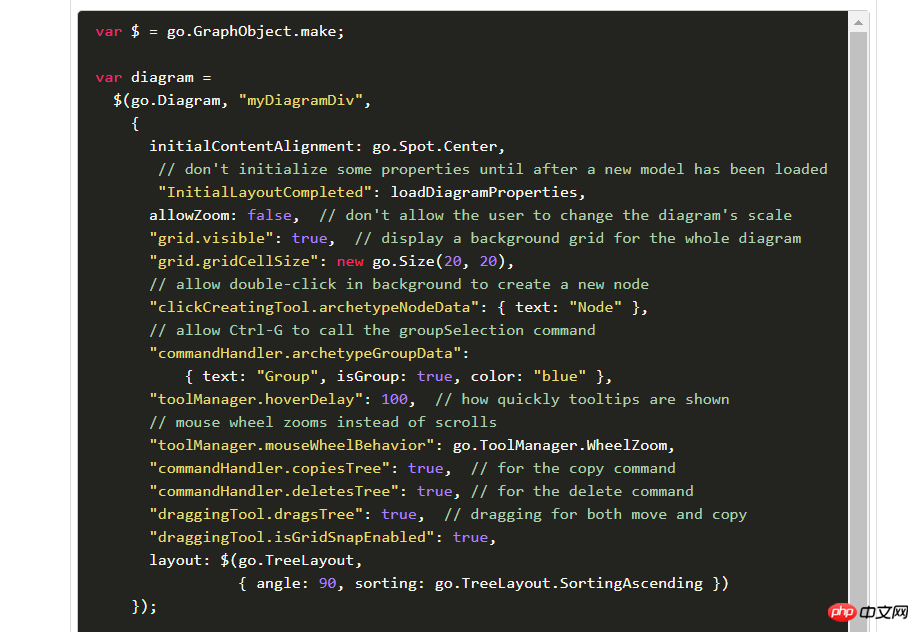
var $ = go.GraphObject.make; // for more concise visual tree definitions
myDiagram =
$(go.Diagram, "myDiagramp",
{
"grid.visible": true,
"grid.gridCellSize": new go.Size(30, 20),
"draggingTool.isGridSnapEnabled": true,
"resizingTool.isGridSnapEnabled": true,
"rotatingTool.snapAngleMultiple": 90,
"rotatingTool.snapAngleEpsilon": 45,
"undoManager.isEnabled": true
});
// when the document is modified, add a "*" to the title and enable the "Save" button
myDiagram.addDiagramListener("Modified", function(e) {
var button = document.getElementById("SaveButton");
if (button) button.disabled = !myDiagram.isModified;
var idx = document.title.indexOf("*");
if (myDiagram.isModified) {
if (idx < 0) document.title += "*";
} else {
if (idx >= 0) document.title = document.title.substr(0, idx);
}
});
myDiagram.nodeTemplateMap.add("Process",
$(go.Node, "Auto",
{ locationSpot: new go.Spot(0.5, 0.5), locationObjectName: "SHAPE",
resizable: true, resizeObjectName: "SHAPE" },
new go.Binding("location", "pos", go.Point.parse).makeTwoWay(go.Point.stringify),
$(go.Shape, "Cylinder1",
{ name: "SHAPE",
strokeWidth: 2,
fill: $(go.Brush, "Linear",
{ start: go.Spot.Left, end: go.Spot.Right,
0: "gray", 0.5: "white", 1: "gray" }),
minSize: new go.Size(50, 50),
portId: "", fromSpot: go.Spot.AllSides, toSpot: go.Spot.AllSides
},
new go.Binding("desiredSize", "size", go.Size.parse).makeTwoWay(go.Size.stringify)),
$(go.TextBlock,
{ alignment: go.Spot.Center, textAlign: "center", margin: 5,
editable: true },
new go.Binding("text").makeTwoWay())
));
myDiagram.nodeTemplateMap.add("Valve",
$(go.Node, "Vertical",
{ locationSpot: new go.Spot(0.5, 1, 0, -21), locationObjectName: "SHAPE",
selectionObjectName: "SHAPE", rotatable: true },
new go.Binding("angle").makeTwoWay(),
new go.Binding("location", "pos", go.Point.parse).makeTwoWay(go.Point.stringify),
$(go.TextBlock,
{ alignment: go.Spot.Center, textAlign: "center", margin: 5, editable: true },
new go.Binding("text").makeTwoWay(),
// keep the text upright, even when the whole node has been rotated upside down
new go.Binding("angle", "angle", function(a) { return a === 180 ? 180 : 0; }).ofObject()),
$(go.Shape,
{ name: "SHAPE",
geometryString: "F1 M0 0 L40 20 40 0 0 20z M20 10 L20 30 M12 30 L28 30",
strokeWidth: 2,
fill: $(go.Brush, "Linear", { 0: "gray", 0.35: "white", 0.7: "gray" }),
portId: "", fromSpot: new go.Spot(1, 0.35), toSpot: new go.Spot(0, 0.35) })
));
myDiagram.linkTemplate =
$(go.Link,
{ routing: go.Link.AvoidsNodes, curve: go.Link.JumpGap, corner: 10, reshapable: true, toShortLength: 7 },
new go.Binding("points").makeTwoWay(),
// mark each Shape to get the link geometry with isPanelMain: true
$(go.Shape, { isPanelMain: true, stroke: "black", strokeWidth: 5 }),
$(go.Shape, { isPanelMain: true, stroke: "gray", strokeWidth: 3 }),
$(go.Shape, { isPanelMain: true, stroke: "white", strokeWidth: 1, name: "PIPE", strokeDashArray: [10, 10] }),
$(go.Shape, { toArrow: "Triangle", fill: "black", stroke: null })
);
load();
loop(); // animate some flow through the pipes
}
function loop() {
var diagram = myDiagram;
setTimeout(function() {
var oldskips = diagram.skipsUndoManager;
diagram.skipsUndoManager = true;
diagram.links.each(function(link) {
var shape = link.findObject("PIPE");
var off = shape.strokeDashOffset - 2;
shape.strokeDashOffset = (off <= 0) ? 20 : off;
});
diagram.skipsUndoManager = oldskips;
loop();
}, 100);
}
function save() {
document.getElementById("mySavedModel").value = myDiagram.model.toJson();
myDiagram.isModified = false;
}
function load() {
myDiagram.model = go.Model.fromJson(document.getElementById("mySavedModel").value);
}
</script>
</head>
<body onload="init()">
<p id="sample">
<p id="myDiagramp" style="border: solid 1px black; width:100%; height:500px"></p>
<p>
A <em>process flow diagram</em> is commonly used in chemical and process engineering to indicate the general flow of plant processes and equipment.
A simple SCADA diagram, with animation of the flow along the pipes, is implemented here.
</p>
<p>
The diagram displays the background grid layer by setting <b>grid.visible</b> to true,
and also allows snapping to the grid using <a>DraggingTool.isGridSnapEnabled</a>,
<a>ResizingTool.isGridSnapEnabled</a>, and <a>RotatingTool.snapAngleMultiple</a> alongside <a>RotatingTool.snapAngleEpsilon</a>.
</p>
<p>
The diagram also uses the <b>loop</b> function to animate the links by adjusting the <a>Shape.strokeDashOffset</a> every 100 ms.
</p>
<p>
<p>
<button id="SaveButton" onclick="save()">Save</button>
<button onclick="load()">Load</button>
Diagram Model saved in JSON format:
</p>
<textarea id="mySavedModel" style="width:100%;height:300px">
{ "class": "go.GraphLinksModel",
"nodeDataArray": [
{"key":"P1", "category":"Process", "pos":"150 120", "text":"Process"},
{"key":"P2", "category":"Process", "pos":"330 320", "text":"Tank"},
{"key":"V1", "category":"Valve", "pos":"270 120", "text":"V1"},
{"key":"P3", "category":"Process", "pos":"150 420", "text":"Pump"},
{"key":"V2", "category":"Valve", "pos":"150 280", "text":"VM", "angle":270},
{"key":"V3", "category":"Valve", "pos":"270 420", "text":"V2", "angle":180},
{"key":"P4", "category":"Process", "pos":"450 140", "text":"Reserve Tank"},
{"key":"V4", "category":"Valve", "pos":"390 60", "text":"VA"},
{"key":"V5", "category":"Valve", "pos":"450 260", "text":"VB", "angle":90}
],
"linkDataArray": [
{"from":"P1", "to":"V1"},
{"from":"P3", "to":"V2"},
{"from":"V2", "to":"P1"},
{"from":"P2", "to":"V3"},
{"from":"V3", "to":"P3"},
{"from":"V1", "to":"V4"},
{"from":"V4", "to":"P4"},
{"from":"V1", "to":"P2"},
{"from":"P4", "to":"V5"},
{"from":"V5", "to":"P2"}
]}
</textarea>
</p>
</p>
</body>
</html>工业流程图
四、总结
本文根据js的一些基础用法做了简单介绍,今天就先到这里,以后有问题了再来跟大家分享。如果你的项目里面也有这种业务需求,可以用起来试试!需要说明一点,如果您的公司不缺钱,建议使用正版授权的组件,毕竟尊重作者的劳动成果很重要!
相关推荐:
Vollständiger Code für die Entwicklung von Javascript-EXTJS-Komponenten
Implementieren Sie die Drag-Slider-Überprüfungsfunktion basierend auf der JS-Komponente
Das obige ist der detaillierte Inhalt vonJS-Front-End-Grafik-Plug-in-Tool Gojs-Komponente. Für weitere Informationen folgen Sie bitte anderen verwandten Artikeln auf der PHP chinesischen Website!
In Verbindung stehende Artikel
Mehr sehen- Eine eingehende Analyse der Bootstrap-Listengruppenkomponente
- Detaillierte Erläuterung des JavaScript-Funktions-Curryings
- Vollständiges Beispiel für die Generierung von JS-Passwörtern und die Erkennung der Stärke (mit Download des Demo-Quellcodes)
- Angularjs integriert WeChat UI (weui)
- Wie man mit JavaScript schnell zwischen traditionellem Chinesisch und vereinfachtem Chinesisch wechselt und wie Websites den Wechsel zwischen vereinfachtem und traditionellem Chinesisch unterstützen – Javascript-Kenntnisse