


这是PHP性能优化系列第二期,如何使用PEAR工具类Benchmark逐行获取代码或函数的执行时间。
工欲善其事,必先利其器!
如何安装PEAR和Benchmark
请参考PHP性能优化系列第一期 [PHP性能优化准备篇图解PEAR安装]
Benchmark工具类包说明
直接下载:http://pear.php.net/package/Benchmark/download
Benchmark工具类包共有三个文件,分别是Timer.php、Iterate.php和Profiler.php,三个工具类功能相同,只是侧重点不同,都是用于调试代码获取程序的执行时间。
1,Benchmark_Timer类原理与通过microtime函数获取微秒时间再比较前后两个时间值的差相同。
2,Benchmark_Iterate类用于调试函数的平均执行时间。
3,Benchmark_Profiler类用于统计代码和函数的执行时间以及函数的调用次数。
具体使用方法三个文件内都有详细的使用实例。
如何获取一行或一段代码的执行时间
1,通常使用microtime函数获取代码前后的微秒时间数再比较两个值的时间差,如下
但这种方法很有局限制,不能大范围的应用,而且每次都需要书写很多代码,适合于简单的调试。具体请查看PHP手册详细说明。
2,通过使用benchmark_Timer类获取代码前后执行的时间差,可以同时获取N行代码的执行时间,操作简单,只需要增加一个marker标记即可,请看下面Benchmark_Timer类的使用说明
如何使用Benchmark_Timer类
Benchmark_Timer类只需要在调试文件中增加Benchmark_Timer类初始化声明和marker标注,文件尾打印各个标注处的执行时间,实例如下
- require_once 'Benchmark/Timer.php';$timer = new Benchmark_Timer();$timer->start();$timer->setMarker("marker 01");usleep(1);$timer->setMarker("marker 02");usleep(2);$timer->setMarker("marker 03");usleep(3);$timer->stop();$timer->display();
打印结果有两种方法:
一种是表格输出方式,$timer->display(); 如下图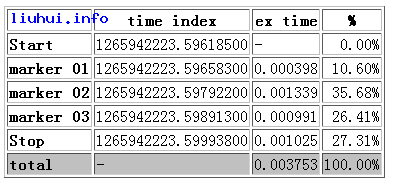
另外一种是手动var_dump或print_r打印,$timer->getProfiling();,print_r函数打印如下图
- array0 =>array'name' => string 'Start' (length=5)'time' => string '1265942405.31334800' (length=19)'diff' => string '-' (length=1)'total' => string '-' (length=1)1 =>array'name' => string 'marker 01' (length=9)'time' => string '1265942405.31374400' (length=19)'diff' => string '0.000396' (length=8)'total' => string '0.000396' (length=8)2 =>array'name' => string 'marker 02' (length=9)'time' => string '1265942405.31423000' (length=19)'diff' => string '0.000486' (length=8)'total' => string '0.000882' (length=8)3 =>array'name' => string 'marker 03' (length=9)'time' => string '1265942405.31519200' (length=19)'diff' => string '0.000962' (length=8)'total' => string '0.001844' (length=8)4 =>array'name' => string 'Stop' (length=4)'time' => string '1265942405.31623800' (length=19)'diff' => string '0.001046' (length=8)'total' => string '0.002890' (length=8)
结果说明
1,name表示标注名称,如上 包含两个特殊标注start和stop表示开始和结束,其次是自定义标注 marker 01 marker 02等
2,time表示当前的微秒时间
3,diff表示上一个标记到当前标记的执行时间,这个就是我们需要获取的时间差,没错,看的就是这个值。
4,total表示执行到当前的整个时间
如何使用Benchmark_Iterate类
Benchmark_Iterate类用于调试函数执行的平均时间,与Benchmark_Timer类不同在于可以多次调用同一个函数获取其执行时间的平均值,实例如下:
- require_once "Benchmark/Iterate.php";$bench = new Benchmark_Iterate;function test($i){ echo $i;}$bench->run(100,"test",10);var_dump($bench->get());
通过调用test函数100次获取平均执行时间,结果如下
- array1 => string '0.000486' (length=8)2 => string '0.000466' (length=8).............................(中间省略)99 => string '0.000479' (length=8)100 => string '0.000467' (length=8)'mean' => string '0.000476' (length=8)'iterations' => int 100
结果说明
1,每个数字表示每次调用的时间
2,mean表示函数执行的平均时间,如上调用100次test函数的平均时间为0.000476
3,iterations表示函数调用的次数
如何使用Benchmark_Profiler类
Benchmark_Profiler类用于统计函数的执行次数和执行时间等,实例如下:
- require_once 'Benchmark/Profiler.php';$profiler = new Benchmark_Profiler(TRUE);function myFunction() { global $profiler; $profiler->enterSection('myFunction'); //do something $profiler->leaveSection('myFunction'); return;}//do somethingmyFunction();//do more
结果如下
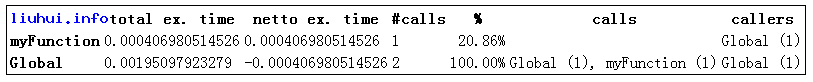
Benchmark_Profiler类在实际性能调试中使用并不多,因为还有比这个更好的工具,如xDebuger等,因此可直接忽略!
Benchmark 工具类在使用调试中针对逐行调试来分析程序性能问题非常实用,主要使用Benchmark_Timer类调试各代码段的时间点,以通过获取执行时间来优化程序提高代码的性能。这里就不再深入讨论,如果在使用的过程中有什么问题欢迎大家一起交流!
如果你发现这种逐行调试很累很辛苦,如果你想从整体上把握程序的性能情况,这个Benchmark类调试工具就不能满足你的需求,下期将讨论PHP性能调试工具xDebuger的安装与使用。
相关资料
microtime
(PHP 3, PHP 4, PHP 5)
microtime -- 返回当前 Unix 时间戳和微秒数
说明
mixed microtime ( [bool get_as_float] )
microtime() 当前 Unix 时间戳以及微秒数。本函数仅在支持 gettimeofday() 系统调用的操作系统下可用。
如果调用时不带可选参数,本函数以 "msec sec" 的格式返回一个字符串,其中 sec 是自 Unix 纪元(0:00:00 January 1, 1970 GMT)起到现在的秒数,msec 是微秒部分。字符串的两部分都是以秒为单位返回的。
如果给出了 get_as_float 参数并且其值等价于 TRUE,microtime() 将返回一个浮点数。
注意: get_as_float 参数是 PHP 5.0.0 新加的。
扩展资料
PHP Benchmark/Timer Class
PHP Benchmark
Benchmark and Optimize PHP Script Speed

 Jenseits des Hype: Beurteilung der Rolle von PHP heute heuteApr 12, 2025 am 12:17 AM
PHP bleibt ein leistungsstarkes und weit verbreitetes Tool in der modernen Programmierung, insbesondere im Bereich der Webentwicklung. 1) PHP ist einfach zu bedienen und nahtlos in Datenbanken integriert und für viele Entwickler die erste Wahl. 2) Es unterstützt die Erzeugung der dynamischen Inhalte und die objektorientierte Programmierung, die für die schnelle Erstellung und Wartung von Websites geeignet sind. 3) Die Leistung von PHP kann verbessert werden, indem Datenbankabfragen zwischengespeichert und optimiert werden, und die umfangreiche Community und sein reiches Ökosystem machen es im heutigen Technologiestack immer noch wichtig.
 Was sind schwache Referenzen in PHP und wann sind sie nützlich?Apr 12, 2025 am 12:13 AM
In PHP werden schwache Referenzen in der WeaPreference -Klasse implementiert und verhindern nicht, dass der Müllsammler Objekte zurückerobern. Schwache Referenzen eignen sich für Szenarien wie Caching -Systeme und Event -Hörer. Es ist zu beachten, dass es das Überleben von Objekten nicht garantieren kann und dass die Müllsammlung möglicherweise verzögert wird.
 Erklären Sie die __invoke magische Methode in PHP.Apr 12, 2025 am 12:07 AM
Mit der \ _ \ _ -Invoke -Methode können Objekte wie Funktionen bezeichnet werden. 1. Definieren Sie die Methode \ _ \ _, damit das Objekt aufgerufen werden kann. 2. Bei Verwendung der Syntax $ OBJ (...) wird PHP die Methode \ _ \ _ aufrufen. 3.. Geeignet für Szenarien wie Protokollierung und Taschenrechner, Verbesserung der Codeflexibilität und Lesbarkeit.
 Erklären Sie Fasern in PHP 8.1 für die Parallelität.Apr 12, 2025 am 12:05 AM
Fasern wurde in Php8.1 eingeführt, wodurch die gleichzeitigen Verarbeitungsfunktionen verbessert wurden. 1) Fasern ist ein leichtes Parallelitätsmodell, das Coroutinen ähnelt. 2) Sie ermöglichen es den Entwicklern, den Ausführungsfluss von Aufgaben manuell zu steuern, und eignen sich zum Umgang mit E/O-intensiven Aufgaben. 3) Die Verwendung von Fasern kann effizientere und reaktionsschnelle Code schreiben.
 Die PHP -Community: Ressourcen, Unterstützung und EntwicklungApr 12, 2025 am 12:04 AM
Die PHP -Community bietet umfangreiche Ressourcen und Unterstützung, um Entwicklern zu helfen, zu wachsen. 1) Zu den Ressourcen gehören offizielle Dokumentation, Tutorials, Blogs und Open -Source -Projekte wie Laravel und Symfony. 2) Die Unterstützung kann durch Stackoverflow-, Reddit- und Slack -Kanäle erhalten werden. 3) Entwicklungstrends können durch Befolgung von RFC gelernt werden. 4) Die Integration in die Community kann durch aktive Teilnahme, Beitrag zum Code und Lernfreigabe erreicht werden.
 PHP vs. Python: Verständnis der UnterschiedeApr 11, 2025 am 12:15 AM
PHP und Python haben jeweils ihre eigenen Vorteile, und die Wahl sollte auf Projektanforderungen beruhen. 1.PHP eignet sich für die Webentwicklung mit einfacher Syntax und hoher Ausführungseffizienz. 2. Python eignet sich für Datenwissenschaft und maschinelles Lernen mit präziser Syntax und reichhaltigen Bibliotheken.
 PHP: Stirbt es oder passt es sich einfach an?Apr 11, 2025 am 12:13 AM
PHP stirbt nicht, sondern sich ständig anpasst und weiterentwickelt. 1) PHP hat seit 1994 mehreren Versionen für die Version unterzogen, um sich an neue Technologietrends anzupassen. 2) Es wird derzeit in E-Commerce, Content-Management-Systemen und anderen Bereichen häufig verwendet. 3) PHP8 führt den JIT -Compiler und andere Funktionen ein, um die Leistung und Modernisierung zu verbessern. 4) Verwenden Sie Opcache und befolgen Sie die PSR-12-Standards, um die Leistung und die Codequalität zu optimieren.
 Die Zukunft von PHP: Anpassungen und InnovationenApr 11, 2025 am 12:01 AM
Die Zukunft von PHP wird erreicht, indem sich an neue Technologietrends angepasst und innovative Funktionen eingeführt werden: 1) Anpassung an Cloud Computing, Containerisierung und Microservice -Architekturen, Unterstützung von Docker und Kubernetes; 2) Einführung von JIT -Compilern und Aufzählungsarten zur Verbesserung der Leistung und der Datenverarbeitungseffizienz; 3) die Leistung kontinuierlich optimieren und Best Practices fördern.


Heiße KI -Werkzeuge

Undresser.AI Undress
KI-gestützte App zum Erstellen realistischer Aktfotos

AI Clothes Remover
Online-KI-Tool zum Entfernen von Kleidung aus Fotos.

Undress AI Tool
Ausziehbilder kostenlos

Clothoff.io
KI-Kleiderentferner

AI Hentai Generator
Erstellen Sie kostenlos Ai Hentai.

Heißer Artikel
Heiße Werkzeuge

Herunterladen der Mac-Version des Atom-Editors
Der beliebteste Open-Source-Editor

MantisBT
Mantis ist ein einfach zu implementierendes webbasiertes Tool zur Fehlerverfolgung, das die Fehlerverfolgung von Produkten unterstützen soll. Es erfordert PHP, MySQL und einen Webserver. Schauen Sie sich unsere Demo- und Hosting-Services an.

ZendStudio 13.5.1 Mac
Leistungsstarke integrierte PHP-Entwicklungsumgebung

EditPlus chinesische Crack-Version
Geringe Größe, Syntaxhervorhebung, unterstützt keine Code-Eingabeaufforderungsfunktion

SecLists
SecLists ist der ultimative Begleiter für Sicherheitstester. Dabei handelt es sich um eine Sammlung verschiedener Arten von Listen, die häufig bei Sicherheitsbewertungen verwendet werden, an einem Ort. SecLists trägt dazu bei, Sicherheitstests effizienter und produktiver zu gestalten, indem es bequem alle Listen bereitstellt, die ein Sicherheitstester benötigen könnte. Zu den Listentypen gehören Benutzernamen, Passwörter, URLs, Fuzzing-Payloads, Muster für vertrauliche Daten, Web-Shells und mehr. Der Tester kann dieses Repository einfach auf einen neuen Testcomputer übertragen und hat dann Zugriff auf alle Arten von Listen, die er benötigt.

